
Monitoring Quarkus applications with Dashbuilder
Blog: Drools & jBPM Blog

Most of Quarkus extensions allow users to expose information in JSON format or metrics to be used by Prometheus. What I miss is a tool that allows us to visualize data from Quarkus or even embed dashboards in my Quarkus application.
In this article we will share a tool called Dashbuilder to help us to build dashboards that run on the client-side, without the requirement of installing anything and be used to monitor Quarkus.
Dashboards with Dashbuilder
Dashbuilder is a Web Application that runs Dashboards in YAML format. It can consume data from JSON arrays, CSV and metrics (the same metrics scrapped by Prometheus). You can transform JSON to arrays using JSONAta expressions.
The data can be displayed in pages composed of Displayers. Displayers can be anything that shows the data, such as a Bar Chart or a Heatmap.
To create dashboards you can use the great online editor. Once the YAML is done then you can deploy the dashboard using the Dashbuilder web app from NPM package @kie-tools/dashbuilder-client with the instructions from Dashbuilder documentation.
Now you may be asking yourself how Dashbuilder can help us with Quarkus applications. Any application that has metrics exposed can be monitored by Dashbuilder without the requirement of using Prometheus or Grafana.
Dashboards for Quarkus monitoring
To monitor quarkus with Dashbuilder only two configurations are required on the Quarkus side:
- Add the extension quarkus-micrometer-registry-prometheus
- If the dashboard is not embedded in Quarkus, then you need to enable cors using quarkus.http.cors=true in application.properties
Now you can use the Dashbuilder online editor to build dashboards:
- Start your quarkus app in dev mode:
- mvn clean compile quarkus:dev
- Check if the metrics are available at http://localhost:8080/q/metrics
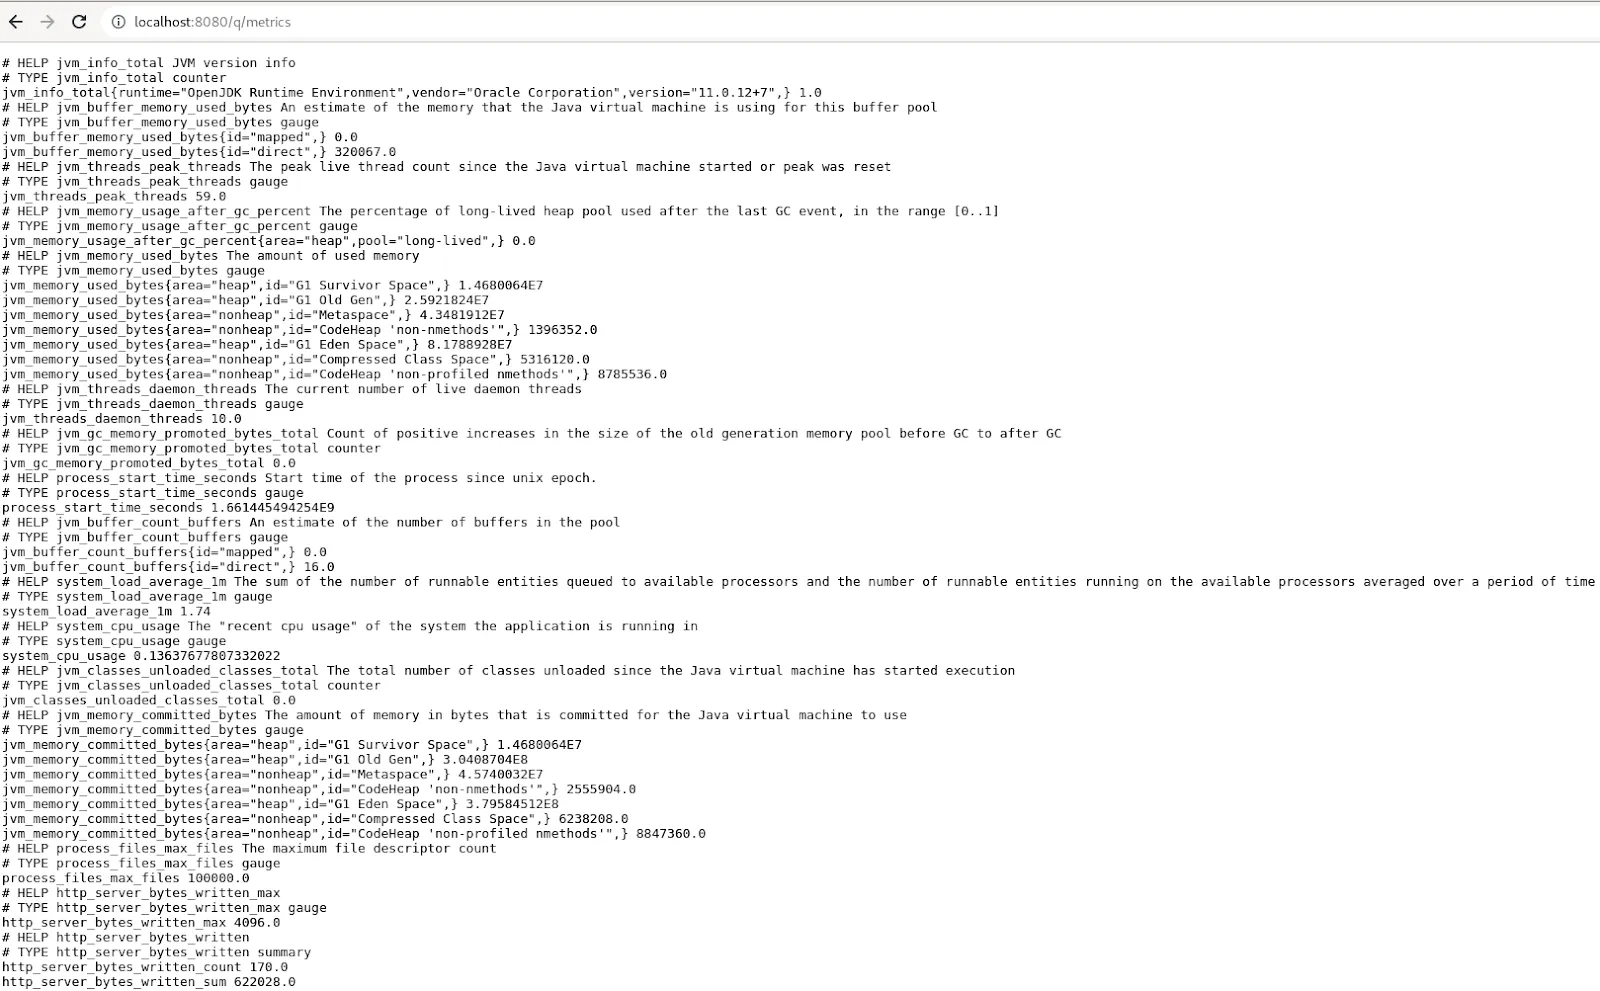
- Go to the Dashbuilder online editor, create a new Dashboard and use the following YAML content:
datasets:
- uuid: metrics
url: http://localhost:8080/q/metrics
pages:
- components:
- settings:
lookup:
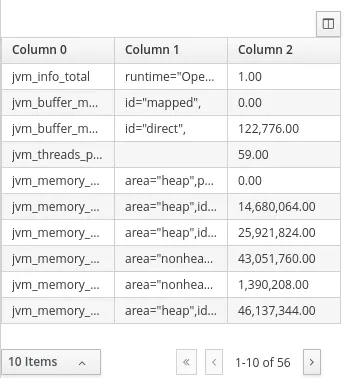
uuid: metricsNow you should be able to see a table with all metrics:
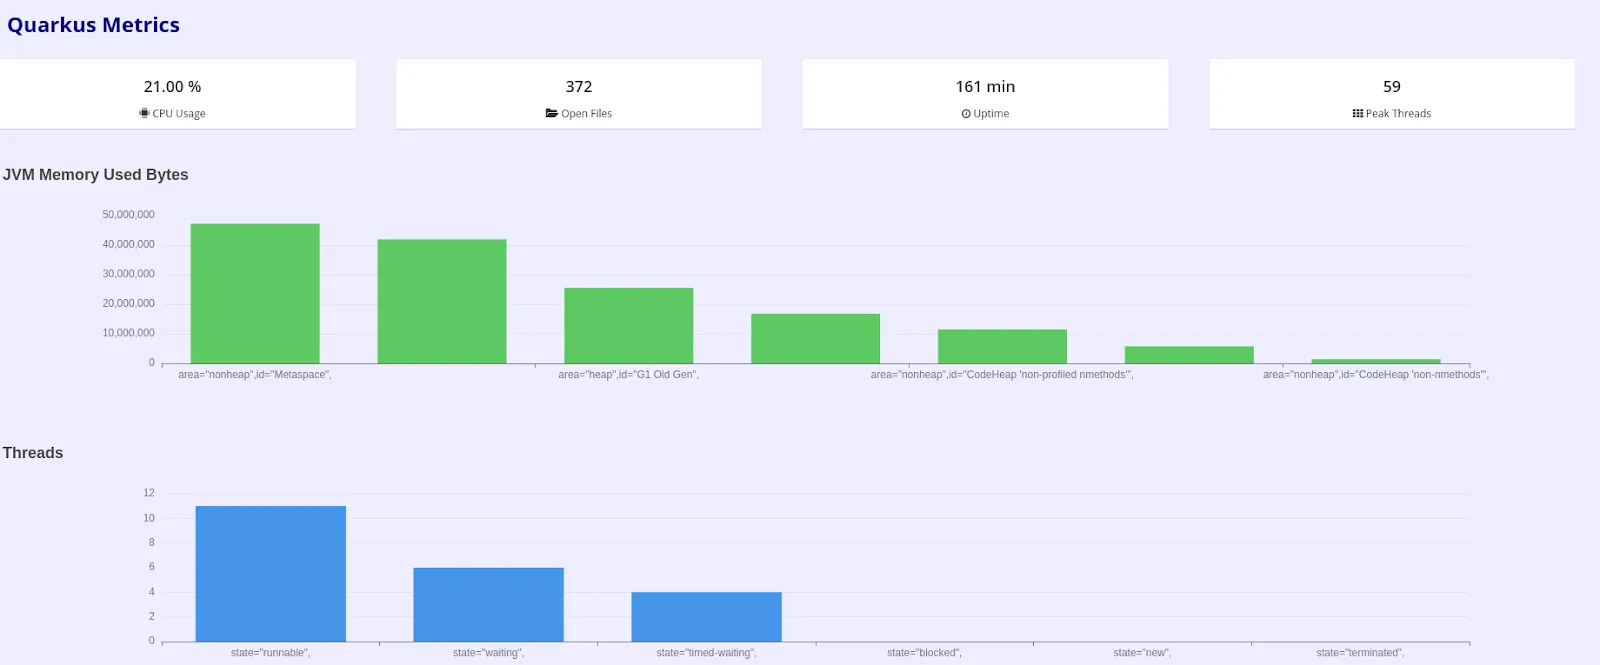
From here you can explore the Dashbuilder YAML guide to build more complex dashboards. In our online editor you can start editing the following dashboard:
Edit this
This dashboard reads the metrics for real time information. Users can change a property on top of the YAML file to make it auto-update (data polling).
Notice that this dashboard does not require the use of Prometheus, but we don’t keep the track of the metrics, however, it is possible to use Dashbuilder with Prometheus as described in CREATING PROMETHEUS DASHBOARDS USING DASHBUILDER.
Embedding dashboards in a Quarkus Application
Dashboards can be embedded in a Quarkus application by simply unzipping Dashbuilder content into the static content folder (resources/META-INF/resources).
To make it easy to use Dashbuilder we created a WebJAR for the NPM package.
You can check a sample application in github or follow the steps below to embed dashbuilder in your application:
- Create the files setup.js and your YAML dashboard in the directory that will contain dashbuilder content. In our case the directory is dashbuilder:
src/main/resources/META-INF/resources/dashbuilder/setup.js
dashbuilder = {
    dashboards: ["hello.dash.yaml"]
}
src/main/resources/META-INF/resources/dashbuilder/hello.dash.yaml
datasets:
  - uuid: metrics
    url: /q/metrics
pages:
  - components:
      - settings:
          lookup:
uuid: metrics- Add the Dashbuilder web jar version to the properties section of your pom.xml
<dashbuilder.version>0.22.0</dashbuilder.version>- Add the Web Jar as a dependency in the dependencies section:
    <dependency>
      <groupId>org.webjars.npm</groupId>
      <artifactId>kie-tools__dashbuilder-client</artifactId>
      <version>${dashbuilder.version}</version>
</dependency>- Add a plugin to unpack Dashbuilder in the plugins section:
   <plugin>
        <groupId>org.apache.maven.plugins</groupId>
        <artifactId>maven-dependency-plugin</artifactId>
        <executions>
          <execution>
            <id>unpack-dashbuilder</id>
            <phase>process-resources</phase>
            <goals>
              <goal>unpack</goal>
            </goals>
            <configuration>
              <artifactItems>
                <artifactItem>
                  <groupId>org.webjars.npm</groupId>
                  <artifactId>kie-tools__dashbuilder-client</artifactId>
                  <version>${dashbuilder.version}</version>
                  <overWrite>true</overWrite>
                  <outputDirectory>${project.build.directory}/dashbuilder</outputDirectory>
                </artifactItem>
              </artifactItems>
              <overWriteReleases>false</overWriteReleases>
              <overWriteSnapshots>true</overWriteSnapshots>
            </configuration>
          </execution>
        </executions>
</plugin>- Finally copy the contents from the dashbuilder package to the destination folder
<plugin>
        <artifactId>maven-resources-plugin</artifactId>
        <version>3.0.2</version>
        <executions>
          <execution>
            <id>copy-dashbuilder-resources</id>
            <phase>process-resources</phase>
            <goals>
              <goal>copy-resources</goal>
            </goals>
            <configuration>
              <outputDirectory>${project.build.outputDirectory}/META-INF/resources/dashbuilder</outputDirectory>
              <resources>
                <resource>
                  <directory>${project.build.directory}/dashbuilder/META-INF/resources/webjars/kie-tools__dashbuilder-client/${dashbuilder.version}/dist/</directory>
                </resource>
              </resources>
            </configuration>
          </execution>
        </executions>
      </plugin>
That’s all! When you start your app then the dashboard will be available in localhost:8080/dashbuilder
Conclusion
In this post we shared Dashbuilder, an alternative to monitor Quarkus applications! Check the sample project at github.
The post Monitoring Quarkus applications with Dashbuilder appeared first on KIE Community.