Making Data Actionable
I’m going to share my top three tips for making data actionable and helping all levels of your organization understand the story the data is telling. These tips include how to:
- Filter big data for the relevant data points
- Create a framework to “operationalize” the data
- Identify the data levers that give context and meaning to the data.
Tip One: Filtering Big Data
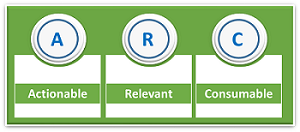
Keep your data story simple by applying ARC:
A – Actionable. The output needs to compel the user of the data to do something meaningful and impactful.
R – Relevant. People need to be directed to the key data that will have the greatest impact on achieving their goals.
C – Consumable. The data needs to be presented in a manner that is easy to comprehend.
I suggest working backwards. Start with the outcome(s) you want to achieve, then determine the factors that influence those outcomes, next determine how to measure those influencing factors, and finally determine where there are data sources for those measurements.
It sounds easy, but in reality it’s a hard methodology to execute. Business consulting services are often needed to help teams through this process. By applying ARC to each of the outcomes and measures identified, you’ve filtered out the noise and found the right data points to drive the desired outcomes.
Tip Two: Sharing and Using Data
So following tip one, you filtered down your data to what is Actionable, Relevant, and Consumable. The next step is to give people direction on how to use and share the data. How often do I look at it? What do I do with it? Who cares about it? In my experience, data is often times presented to front-line workers and managers without providing answers to these questions—and without a mechanism to drive accountability.
In Nancy K. Ansheles’ presentation skills class, I learned the “house” methodology for organizing information. Presentations are another form of storytelling. The house model for data provides infrastructure needed to operationalize the use of data—and then drive results.
Each floor has specific goals, focus, and a management process related to the data. The roof is supported by each floor. Customers are met on the first floor (face to face, contact center, back office). The second floor balances overseeing the front line with overall goals, and the third floor oversees everything, providing vision and strategy.
If we just deploy a solution on the first floor and leave it to the front line to execute, we’ve only created a partial house. The house needs stairways to drive visibility, transparency, and accountability—they are the pathway of communication between floors. Stairs guide how frequently different levels of management engage and why, what data they have access to and can share, and how business decisions are made based on the data.
Verint Workforce Optimization acts as the stairs and creates a standardized framework that helps enable the sharing of data across groups. Data from a single interaction or employee task can be rolled up to organization-wide dashboards, with individual, team and department goals all tied to the corporate objectives.
For example, if Sally SVP has a list of metrics that she is managing her team to, she should be discussing them with her direct reports. Sally’s direct reports should drill down to the next level of metrics and be discussing these with their direct reports. This should cascade from the top of the house to the front line. The SVP that does not have these discussions could be seen as not caring about them by the front line. If the SVP does not pay attention, then chances are neither will the front line.
Part two of this blog series will focus on understanding the push-pull impact on data.
The post Making Data Actionable appeared first on Customer Experience Management Blog.
Leave a Comment
You must be logged in to post a comment.