Making Data Actionable – Part Two
Part one of this blog series discussed keeping your data story simple by applying the ARC approach: Actionable, Relevant, and Consumable. I’ll now highlight the importance of understanding the push-pull impact on your data.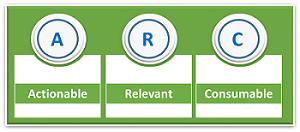
While Sir Isaac Newton predates the age of big data, we can learn a valuable lesson about data from one of his laws of motion: “For every action there is an equal and opposite re-action.” No single data point lives by itself. There are other related data points or levers that are pushing and pulling on the data, changing its meaning and value based on the force of the data lever.
Tip Three – Understand the “Push-Pull” Impact on Data
If a metric moves in one direction, there is typically another metric that is moving in tandem in the same direction—or in the opposite direction. Too often, however, organizations make an assumption that the front line will intuitively understand this and know which data levers impact their performance metrics, and what the implications of these are on their desired outcomes.
Let’s pretend to be an enterprise workforce optimization manager who is experiencing a sudden, unexpected rise in overtime costs. Assume your staff is seasoned and the staffing levels are consistent. What is causing the overtime?
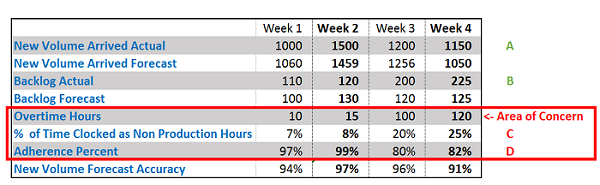
In the dashboard above, we see next to the letter A the arrival volumes forecast is accurate, so an unplanned increase of work is not the issue. Backlog, next to the letter B above, is steadily rising—a concern but not the cause. Potential root causes are time in non-production activity (letter C) and schedule adherence (letter D). When comparing Week 1 to Week 4, we can see that adherence has dramatically dropped from 97 percent to 82 percent, and time in non-production work has increased from 7 percent to 25 percent.
So, knowing that overtime is increasing did not provide us with the information we needed to take action. Understanding the influencing data levers of non-production work and adherence gives us the full picture, so we can now develop an action plan and manage our team to better results.
Bottom-line, front-line managers who cannot (or do not) interpret data will likely misinterpret it or give up using data. My tip is that when implementing new measure-and-manage programs, such as workforce optimization, organizations need to invest the time to:
- Filter data to help ensure metrics are actionable, relevant and consumable
- Provide an infrastructure to share and operationalize data to drive results
- Teach front-line managers how to interpret and actually use the data provided, especially the related data levers.
By doing so you will help ensure the data is actionable, that front-line managers are comfortable with managing to the new metrics, and that the organization achieves the value and business results sought by the program.
The post Making Data Actionable – Part Two appeared first on Customer Experience Management Blog.
Leave a Comment
You must be logged in to post a comment.