
Making Analytics Location-aware
Blog: The Tibco Blog
A commonly held myth in the geospatial industry states that 80 percent of all data contains a geographic component. Unfortunately, this myth, like the myth that Einstein once said he “considered geography but found it too hard so he switched to physics”, has never been verified.
Here at TIBCO, we believe that the percentage of location-enabled content is much higher than the mythical 80 percent. Surely, a huge percentage of content has direct location data such as addresses, coordinates, landmarks, and IP addresses. But it’s not just about geographic customer information. Location is included in almost every financial transaction, stock transaction, location tracking, and calculated location data such as a URL resolved to a physical address.
Location data is only expected to grow, with Gartner estimating 20 billion connected devices by 2020, more location-enabled content is generated every second, with more organizations looking to harness location data. A few examples include smart cities, connected vehicles, IoT, and smart factories.
Charts, graphs, and tables aren’t enough to discern all the valuable information found in location data. Spatial context needs to be added to this data to help turn that data into deeper insights. This is what Location Intelligence (LI) is all about.
Spotfire = LI for Everyone
Spotfire Location Analytics is Location Intelligence for everyone, giving users access to spatial analytics without the learning curve of geographic information system (GIS), but with the depth and capabilities needed to predict and optimize through location.
With Spotfire Location Analytics, the possibilities are endless. A few examples of what you can do are:
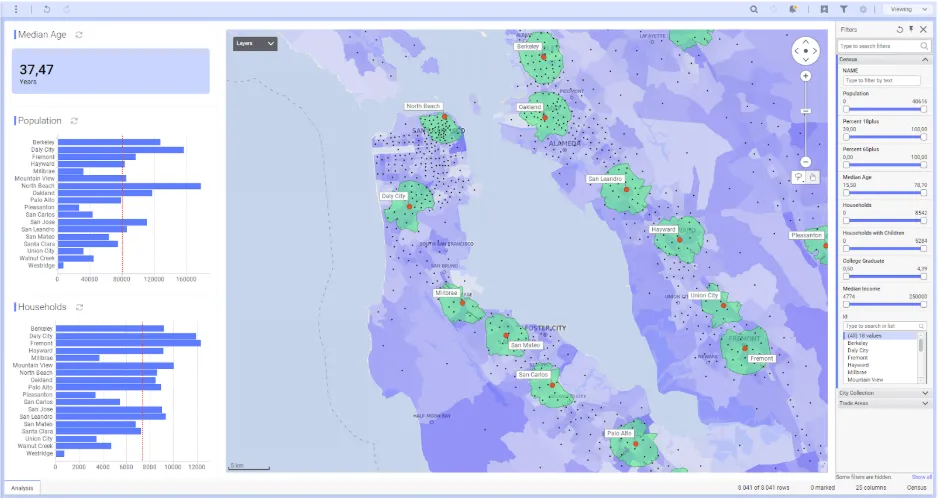
- Identify places and populations that meet the required criteria by filtering through demographic data
- Optimize resources allocation by analyzing localized needs
- Make predictions using historical and current data trends.
Results are directly visible in the form of easy-to-read maps. Maps are unique in their ability to generate insights quickly and clearly.
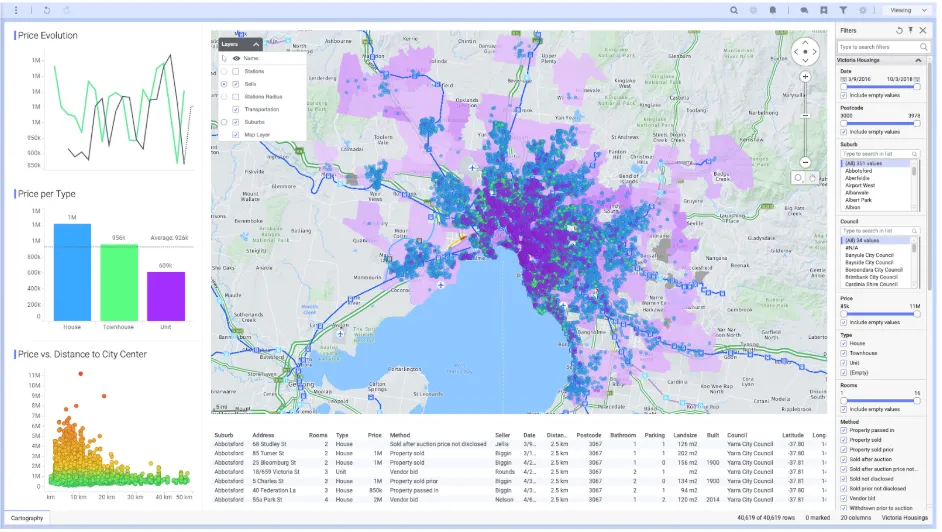
Common benefits recognized by Spotfire Location Analytics users include:
- Turning data into location-based insights automatically with beautiful, location-aware visualizations for business users, analysts, scientists, and developers.
- Connecting data to the real-world to clearly determine how location relates to other data features. This is often the best context to answer the “where” in your data, finding new opportunities and optimizing operations.
- Improving information management, enhancing communication (everyone understands a map!), making more informed decisions, reducing costs, and increasing revenue.
Exceptional maps, now even more exceptional.
Spotfire has the leading location analytics capabilities among visual analytics tools on the market. With Spotfire X, we extended this advantage further with real-time maps and a set of smaller but useful improvements.
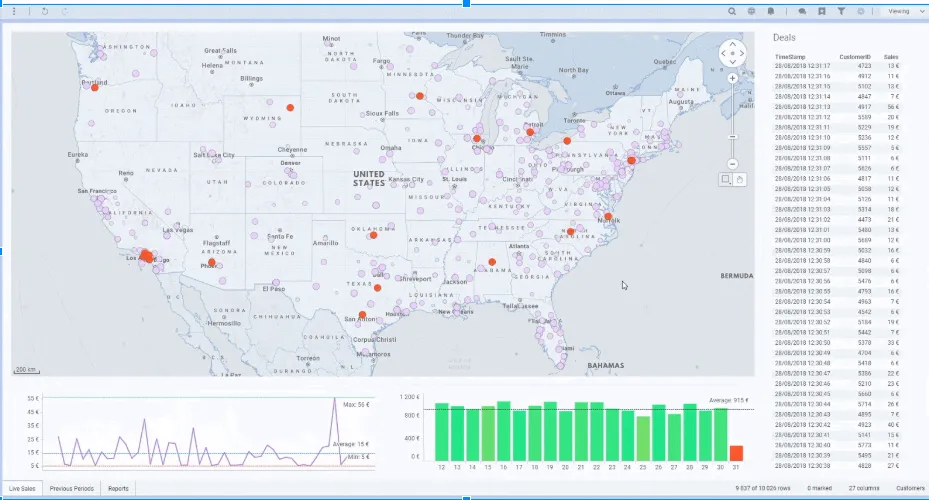
Real-time data on maps
While most location intelligence or location analytics tools analyze historical data, with Spotfire X, you can analyze what is happening right now, over time, in real-time, and pair that information to historical data. As a result, you can monitor, analyze, and make decisions at the right time in the context of a geography.
More data on the map
Spotfire X offers geocoding updates and additional coverages in the US:
- Now covering over 180,000 cities worldwide for improved discovery and more complete maps at the city level.
- Now mapping data to new administration levels in the USA: area codes, census block groups, CBSAs, congressional districts, and school districts.
Accelerated GIS data access
Important new features for users who deal with GIS data. Spotfire is now able to:
- Import spatial objects from Microsoft SQL, Oracle, Postgres, and PostGIS databases. This will save you a lot of time as there is no need to export as a Shapefile and import in Spotfire; just import from the database.
- Read the projection definition (.prj) that usually comes with Shapefiles and applies it automatically meaning no more manual setup required.
- Configure CRS/Projection from the web in Spotfire Business Author with an improved UI for browsing through CRS/Projections that provide more information to help you pick the right system.
- Support even more CRS and projections systems.
To learn more about Spotfire Location Analytics, watch the webinar, Making Analytics Location-aware with TIBCO Spotfire X, and try Spotfire X for free with a 30-day trial.