Blog Posts Process Management

Joget v5 Performance Analyzer

Blog: Joget Unplugged

The Performance Analyzer is a new feature in Joget Workflow v5 Enterprise Edition that allows administrators and app designers to analyze the performance of their apps and to identify possible bottlenecks.


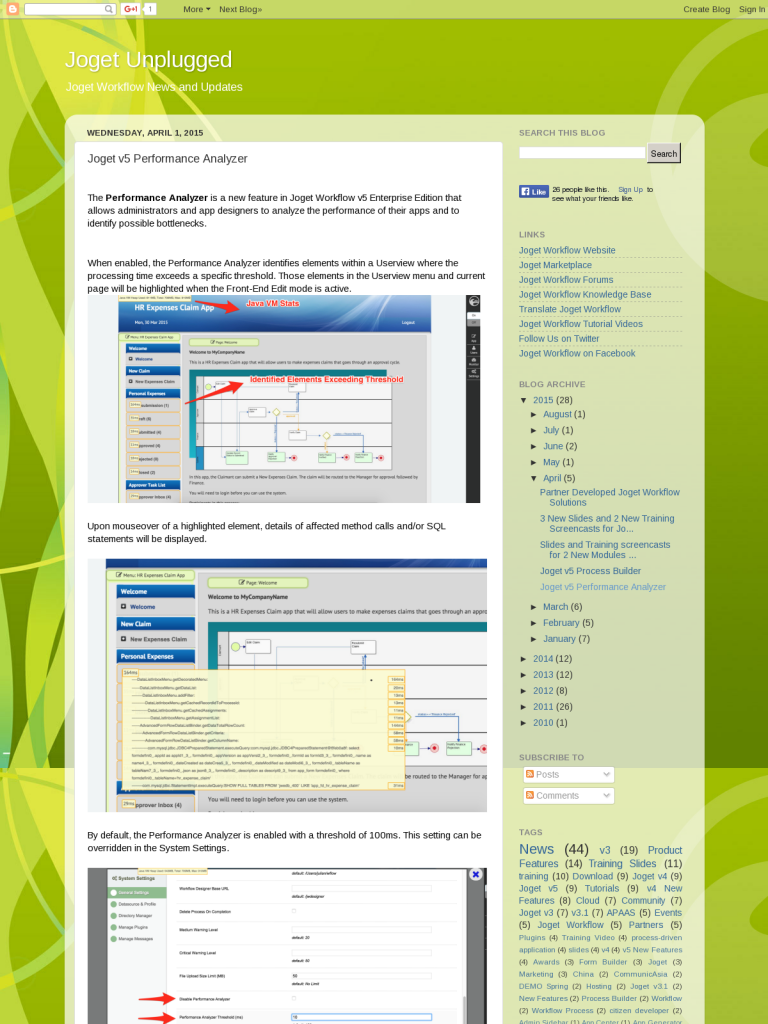
When enabled, the Performance Analyzer identifies elements within a Userview where the processing time exceeds a specific threshold. Those elements in the Userview menu and current page will be highlighted when the Front-End Edit mode is active.

Upon mouseover of a highlighted element, details of affected method calls and/or SQL statements will be displayed.

By default, the Performance Analyzer is enabled with a threshold of 100ms. This setting can be overridden in the System Settings.

Leave a Comment

Get the BPI Web Feed

Using the HTML code below, you can display this Business Process Incubator page content with the current filter and sorting inside your web site for FREE.

Copy/Paste this code in your website html code:

<iframe src="https://www.businessprocessincubator.com/content/joget-v5-performance-analyzer/?feed=html" frameborder="0" scrolling="auto" width="100%" height="700">

Customizing your BPI Web Feed

You can click on the Get the BPI Web Feed link on any of our page to create the best possible feed for your site. Here are a few tips to customize your BPI Web Feed.

Customizing the Content Filter
On any page, you can add filter criteria using the MORE FILTERS interface:

Customizing the Content Filter

Customizing the Content Sorting
Clicking on the sorting options will also change the way your BPI Web Feed will be ordered on your site:

Get the BPI Web Feed

Some integration examples

BPMN.org

XPDL.org

×