Javascript charts comparator
Blog: Smile - Le blog des consultants
As nowadays applications rely more and more on displaying numeric data, the need for charts libraries grows accordingly. In the Javascript ecosystem, there are quite a few libraries available, which each have their own subtleties, sometimes style wise, sometimes features wise.
Javascript charts comparator is a Storybook implementation, available at our Github team, that presents the most used libraries in the field, so developers can see the same chart type over various libraries and thus be able to choose the right library for their functional or visual need.
Interact and compare
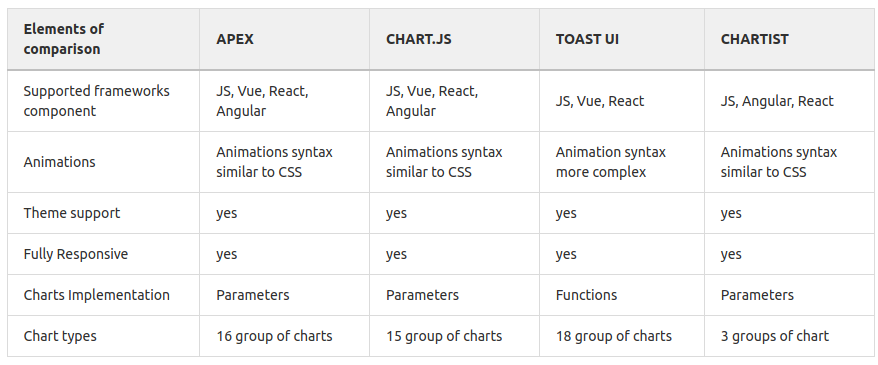
We focused on four libraries which are among the most used open source charts libraries in Javascript : Apexcharts, Chart.js, Ui.Toast and Chartist.
We propose in the repository, two level of information, first through an interactive Storybook that holds chart examples under few categories : Area charts, Bar charts, Box charts, Donut & Pie…
Second, we built a small comparison table for the libraries highlighting their features scope.
Get the code
Project is available over Github : https://github.com/Smile-SA/javascript-charts-comparator. Any question can be sent to rnd@smile.fr.
Follow the Readme.md to launch Storybook and make your own comparison !
Javascript charts comparator was originally published in Smile Innovation on Medium, where people are continuing the conversation by highlighting and responding to this story.
Leave a Comment
You must be logged in to post a comment.