How to use queries as a data source for dashboards
Blog: Aris BPM Blog
In my previous blog post, I showed you how you can build your first dashboard. Before you start building dashboards, you have to prepare data that will be used to display required information. One of the options is to use a query as a data source. In this post, I will show you how to do that.
In ARIS Architect, go to “Analyses” and then to ”Queries”. On the top left, select the “New” icon and choose „Query“.

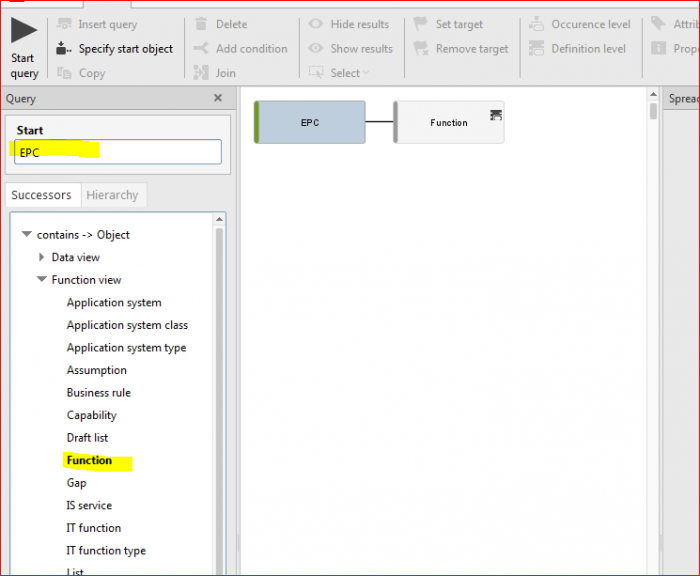
We are interested in processes, functions, and roles (this will be explained in another post, but for the moment, my goal is to build a dashboard which shows how many roles are involved in activities etc.). This means that as the starting point choose „EPC“. For that EPC, we want to have all the functions and roles.
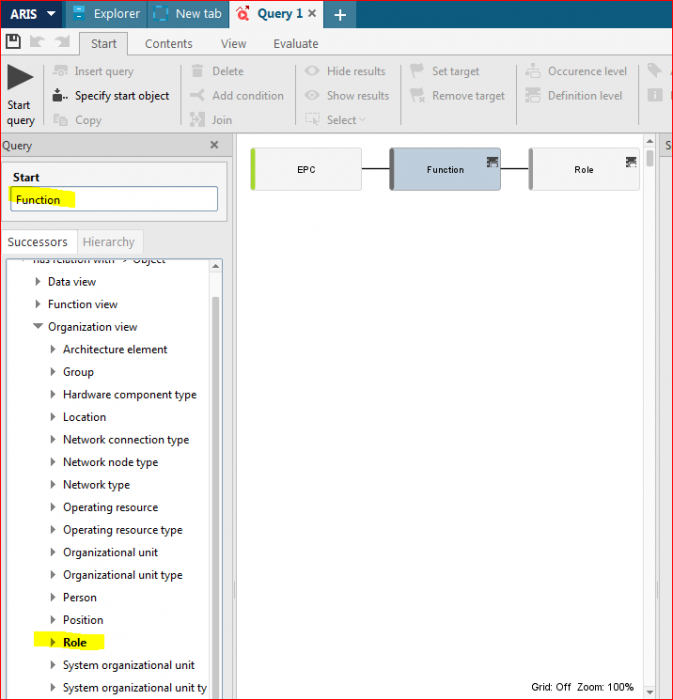
Before you choose „Role“, click on „Function“ in your model, so that the role is displayed following the function. After you click on „Function“, the function will be displayed as start position. In case you don´t click the function, the role will be displayed under the function, following the EPC.
As dashboarding input the table view is necessary. Click the „Create table view“ icon on the toolbar.
In the first row, write activity and role as this is what we are interested in. Then drag and drop the definition item there. Also activity_Guid and role_Guid is needed. In the second row, choose “=queary_item_guid(A2)” for activity_Guid and “=queary_item_guid(B2)” for role_guid.
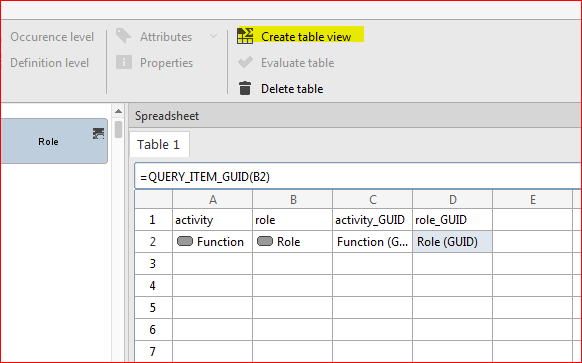
Save this query (ctrl+S) and name it ProcessActivityRole.
That is all that is needed to use it as a data source for a dashboard. What you can also do is select the template that you need and create a dashboard link.
Select the “Data” tab on the toolbar and then click „Generate dashboard link”. Select “Use the first row as a header” and click “Copy to clipboard”.

Now we are getting closer to use this query as a data source for our dashboard.
Go to ARIS Connect > Repository> Dashboards and Feeds> Data feeds and select the plus icon to create a new data feed. Creating a data feed makes it possible to combine various data sources or to use a data source for several widgets without creating the same definition again and again.
![]()
On the left side we can select various types of data sources. Choose ARIS table. As we haven´t created an ALIAS (I will show you how to do that in one of my next posts), you paste the URL you have copied to the clipboard before. In section “Manage” (on the right), choose “Save as”.
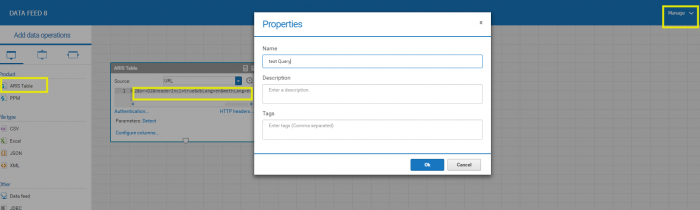
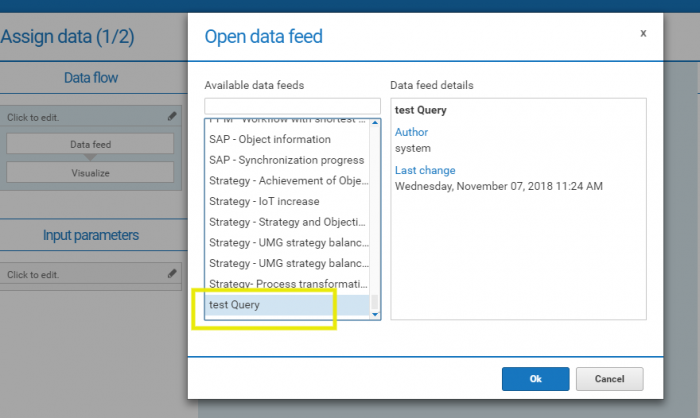
I named it “test Query”. You can also add some descriptions that might be useful for your better orientation later when you have more queries. When you have saved the data feed, it can be used as a data source for our dashboard (as shown in my previous post).