Blog Posts Process Management

How to Use Data to Create Effective Dashboards for Your Change Projects

Blog: Changefirst Blog

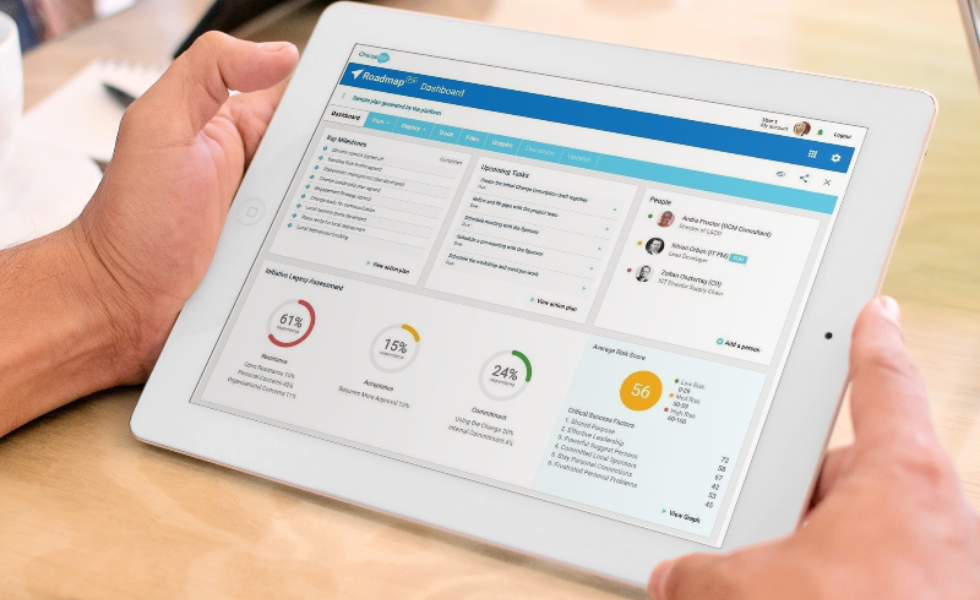
We often get asked the best way to report on the progress of change projects.  Our quick answer is: use data.  Our slightly longer answer is: use a Change Management approach or Change Management platform that allows you to easily measure and track your key success factors through the lifecycle your change projects.

Leave a Comment

Get the BPI Web Feed

Using the HTML code below, you can display this Business Process Incubator page content with the current filter and sorting inside your web site for FREE.

Copy/Paste this code in your website html code:

<iframe src="https://www.businessprocessincubator.com/content/how-to-use-data-to-create-effective-dashboards-for-your-change-projects/?feed=html" frameborder="0" scrolling="auto" width="100%" height="700">

Customizing your BPI Web Feed

You can click on the Get the BPI Web Feed link on any of our page to create the best possible feed for your site. Here are a few tips to customize your BPI Web Feed.

Customizing the Content Filter
On any page, you can add filter criteria using the MORE FILTERS interface:

Customizing the Content Filter

Customizing the Content Sorting
Clicking on the sorting options will also change the way your BPI Web Feed will be ordered on your site:

Get the BPI Web Feed

Some integration examples

BPMN.org

XPDL.org

×