How to power up your business intelligence with Power BI – and why you should
Blog: Professional advantage - BPM blog
When a competitor starts eating into your market share, or industry disruption threatens your business model, what do you do?
Do you seek refuge under a desk and hope your company is spared? Or do you assemble your troops, collect intelligence and determine the best way to respond?
Unless you’re serious about jeopardising your colleagues’ livelihoods, chances are you do the latter.
Organisations across industries are changing because the business environment is changing. To keep up, managers and executives must make informed decisions quickly. They need access to accurate, reliable data, as well as a way to transform that data into actionable insights.
Many are turning to business intelligence software like Microsoft Power BI to gain a competitive advantage. Your organisation may have recently done the same.
But how exactly does Power BI support businesses to make smarter decisions? What’s happening behind the scenes?
In a recent webinar, I explained how Power BI components (dashboards, reports and datasets) relate to each other.
Here’s a brief summary of the webinar’s key points, and a closer look at how Power BI helps organisations power up their business intelligence.
Why businesses love Power BI
If there were a people’s choice award for best BI platform, Power BI would be the clear winner. Five million subscribers can’t be wrong.
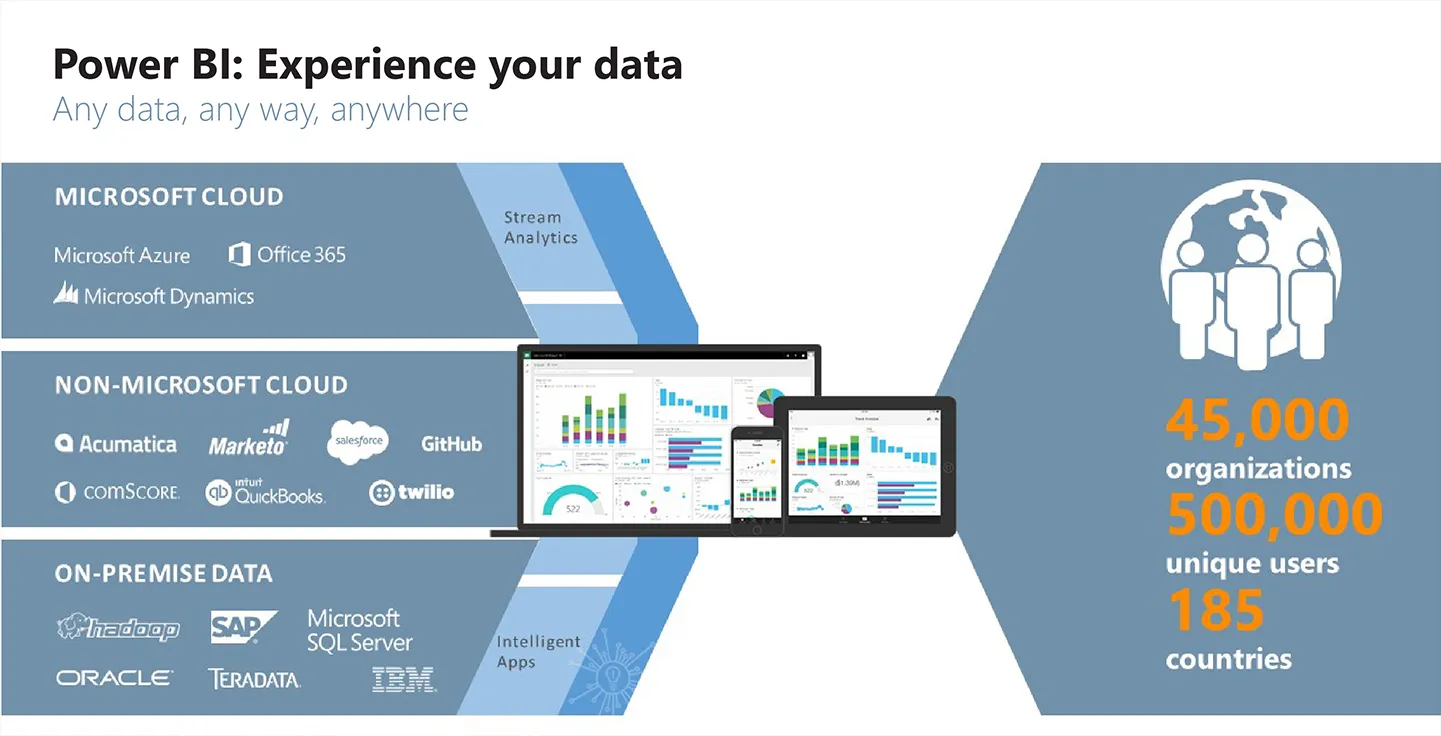
Our Power BI clients tell us they like the product’s advanced visualisation options, natural query capabilities and out-of-the-box connectors to cloud services like Salesforce, Marketo and Google Analytics.
They also say they appreciate:
• That users can view accurate and reliable reports without IT support
• Self-service functionalities so users spend less time creating reports, and more time on decision-making and planning
• The ability to collect, create and visualise data in a variety of ways
Dashboards, reports and datasets make each of these benefits possible. Let’s dig deeper.
Dashboards made simple
The Power BI dashboard is a central location for monitoring performance. It’s like observing your organisation from a high vantage point: a different perspective makes it easier to identify bottlenecks, inefficiencies and opportunities.
Dashboard functionality is available to all Power BI web users. Employees can view visualisations, consume reports and share findings with others. Colleagues can view and interact with shared dashboards, but can’t edit them – this maintains data integrity.
If you and your colleagues have Power BI Pro licences (the premium version of Power BI), you can publish dashboards to group workspaces where everyone can view, edit and interact as needed. You can also share dashboards with people outside of the group with read-only access. Read more about the differences between Power BI’s free and premium versions.
Straightforward report generation
Have you ever asked IT to generate a report, only to receive outdated information weeks later? With self-service reporting, Power BI eliminates this headache.
The types of reports you generate will depend on what insights you seek, and how you prefer to interpret collected data. However, it is usually as easy as finding information on the dashboard that you’d like to dig into deeper, and creating a report to discover more.
Most of our Power BI clients choose to build reports in Power BI Desktop (an authoring tool for generating reports) or Excel. They decide which data should appear in each report, and choose the most appropriate visualisations for communicating their findings.
Once a report is completed, it is published to Power BI on the web to share with other users.
Preparing datasets
Datasets are at the heart of Power BI – they’re behind every visualisation, dashboard and report. However, reports often provide the most in-depth insights into your datasets.
While it is possible to create datasets using Excel, we recommend using Power BI Desktop to prevent design inconsistencies that can occur when you use different versions of Excel. What’s more, Power BI Desktop was designed to complement Power BI on the web, which makes it an obvious choice for stress-free data loading.
Improve your Power BI know-how
If you’ve read this far, you’ll know that Power BI supports informed decision-making and improves agility and collaboration. But do you have the technical skills to make the most of the platform’s capabilities?
Whether you need to get familiar with dashboards or want to confidently report on your own data, Professional Advantage has a training option to suit.
You’ll learn about Power BI from Australia’s preferred Microsoft partner, either on site or at Professional Advantage’s state-of-the-art training labs.
Power BI training sessions
• Dashboard in a Day – Full day session introducing Power BI on the web and Power BI Desktop
• Starter Pack – Full day session providing a foundation for working with Power BI, including reporting on your own data.
Read more about Power BI and Professional Advantage.
The post How to power up your business intelligence with Power BI – and why you should appeared first on blog.pa.com.au.