How to find a bottle-neck in your rule for performance analysis
Blog: Drools & jBPM Blog
Rule performance analysis is a quite popular topic among Drools users. Of course, it’s not a simple task. Performance could be affected by various factors and the environment. A root cause might be
garbage collection, application logic or even accesses to an external system from RHS. This article doesn’t cover all possibilities but only focuses on a bottle-neck caused by rule evaluation.
I talked about this topic on a KieLive session “Drools troubleshooting”.This blog post covers the same debugging techniques with drools-metric and hopefully, elaborates in more details.
A module drools-metric is available since Drools 7.41.0.Final.
If you enable MetricLogUtils, it will log constraint evaluation count and elapsed time on Phreak Nodes. It will help you find a bottle-neck in your rules.
Example use case
Here is an example project that I’m going to use in this troubleshooting walk-through.
https://github.com/tkobayas/MetricLogUtils/tree/master/use-cases/use-case-join
This example contains only one rule so you may quickly notice that this rule is badly written. But imagine that you have thousands of rules and they are more complex. It would be difficult to find a suspicious rule just by reviewing.
rule "Collect expensive orders combination"
when
  $c : Customer()
  $o1 : Order(customer == $c)
  $o2 : Order(customer == $c, id > $o1.id, price > $o1.price)
  $maxPrice : Integer() from accumulate (Order(customer == $c, $price : price), max($price))
  eval($o1.getPrice() > ($maxPrice - 50))
then
  …
end
Enable metric logging
You need 3 steps to enable metric logging.
Firstly, add drools-metric dependency to your project.
NOTE: You can use drools-metric with kie-server by dropping drools-metric-xxx.jar (you can find it in public maven repo) into kie-server.war/WEB-INF/lib. In this case, please test with single thread (multi-threads will confuse your analysis). I recommend to test your rules with standalone java like this example rather than on kie-server.
Secondly, enable MetricLogUtils by system property (-Ddrools.metric.logger.enabled=true). You can optionally configure logging threshold with microseconds (-Ddrools.metric.logger.threshold=100). Default is 500.
Thirdly, enable trace level logging for org.drools.metric.util.MetricLogUtils.
Note that the metric logging is not for production environment. You should use this in your test environment when you want to analyze/detect a bottle-neck.
ReteDumper
Before looking into metric logging, let me talk about ReteDumper. ReteDumper is a utility class that dumps Rete node network which is generated from your all rules. The network requires some advanced knowledge of Drools but is a key factor to understand how rules are executed internally.
Simpley call ReteDumper.dump() method with your KieBase instance.
    ReteDumper reteDumper = new ReteDumper();
    reteDumper.dump(kbase);
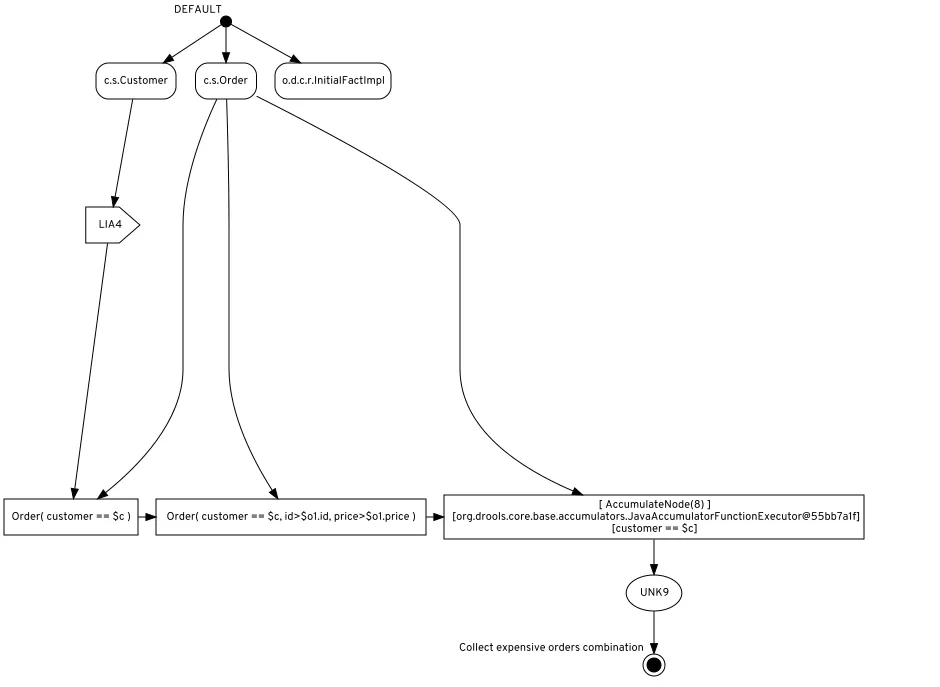
With the example DRL, the generated network is the following:
[EntryPointNode(1) EntryPoint::DEFAULT ] on Partition(MAIN)
[ObjectTypeNode(3)::EntryPoint::DEFAULT objectType=[ClassObjectType class=com.sample.Customer] expiration=-1ms ] on Partition(MAIN)
[LeftInputAdapterNode(4)] on Partition(1) Ld 0 Li 0
[JoinNode(6) - [ClassObjectType class=com.sample.Order]] on Partition(1) Ld 0 Li 0 Rd 22 Ri 22
[JoinNode(7) - [ClassObjectType class=com.sample.Order]] $o1.id, price > $o1.price]> on Partition(1) Ld -1 Li -1 Rd 22 Ri 22
[ AccumulateNode(8) ] on Partition(1) Ld -1 Li -1 Rd 18 Ri 18
[EvalConditionNode(9)]: cond=com.sample.Rule_Collect_expensive_orders_combination930932360Eval1Invoker@ee2a6922] on Partition(1) Ld -1 Li -1
[RuleTerminalNode(10): rule=Collect expensive orders combination] on Partition(1) d -1 i -1
[ObjectTypeNode(5)::EntryPoint::DEFAULT objectType=[ClassObjectType class=com.sample.Order] expiration=-1ms ] on Partition(MAIN)
[JoinNode(6) - [ClassObjectType class=com.sample.Order]] on Partition(1) Ld 0 Li 0 Rd 22 Ri 22
[JoinNode(7) - [ClassObjectType class=com.sample.Order]] $o1.id, price > $o1.price]> on Partition(1) Ld -1 Li -1 Rd 22 Ri 22
[ AccumulateNode(8) ] on Partition(1) Ld -1 Li -1 Rd 18 Ri 18
[ObjectTypeNode(2)::EntryPoint::DEFAULT objectType=[ClassObjectType class=org.drools.core.reteoo.InitialFactImpl] expiration=-1ms ] on Partition(MAIN)
You may find the idea how a rule is decomposed to multiple nodes and may find some parts in a node (e.g. contraints=[customer == $c, id > $o1.id, price > $o1.price]) can be associated with some parts in a rule.
Also dumpAssociatedRules() method dumps a list of nodes with associated rules. It will help you to find related rules from a problematic constraint/node.
Let’s start troubleshooting.
JoinTest inserts 10 Customer objects and 100 Order objects per Customer (So 1000 Order in total).
When you run JoinTest, you will see logs like this:
You find that [ AccumulateNode(8) ], evalCount:4950000, elapsedMicro:1277578 is outstanding.
Let’s go back to dumpAssociatedRules() output. [ AccumulateNode(8) ] is associated to a rule [Collect expensive orders combination]. So we should review the rule. You may find what’s wrong in the rule by reviewing. But the log will help further.
Analysis: Get more hints
If evalCount is unusually large, we should look at its previous node’s log. It’s [JoinNode(7) - [ClassObjectType class=com.sample.Order]], evalCount:100000, elapsedMicro:205274. Accumulate is evaluated for every $o1/$o2 combination which the JoinNode produced. Okay, that’s wrong. This accumulate is just to calculate max price of orders of a customer. So you should evaluate it just once per customer. Let’s move it right after $c : Customer().
See, it’s much faster! (AccumulateNode’s evalCount:1000 is right. It has to evaluate 100 orders per customer anyway).
Analysis: Next bottle-neck
But don’t you want further improvement? [JoinNode(8)] evalCount:100000 and [EvalConditionNode(9)] evalCount:49500 still look significant. This “100000” suggests that cross-product is happening (remember that 100 Order objects are inserted per Customer). Remind the golden rule “List the most restrictive rule conditions first”. This constraint ($o1.getPrice() > ($maxPrice - 50)) is very restrictive so we should evaluate it earlier. Also note that field constraint is preferred over eval() because field constraint will have more chance to get optimized by engine.
So finally, the rule is:
Now we get additional 32% performance gain 🙂
NOTE: This example test doesn’t do “warm-up” so the measured time (= first-run) is quite slower than long-run average time (Drools engine does lots of optimization during long-run). This troubleshooting procedure is still valid to improve ineffective rules but you can also analyze metric log of long-run test.