How to Evaluate Workflows by Flowcharting
Blog: ProcessMaker Blog
There are numerous examples of businesses who feel overwhelmed with tasks and work. The general experience is there aren’t enough hours in the day to get everything accomplished. Even with all the theories and practices on procedural streamlining, it takes action and organization to put the right steps in place. Although, developing efficient workflows can help to save time and the associated costs of redundant processes. Yet, not every workflow is created equal – they do need to be evaluated.
In this article, we will look at workflow evaluation via flowcharting. We’ll explore the benefits of flowcharting and describe how to initiate the process.
Defining the workflow
A workflow can be described as an overview of a specific business process. It will detail how tasks are completed from beginning to end. Usually, it also designates which employee is responsible for various tasks at differing points in the process. Before a workflow is defined, it needs to be evaluated to identify critical components within the business process.
How are workflows helpful? Well, they help team members to comprehend what role they place in ensuring the work is completed. Workflows also help to create enhanced collaboration between participating departments. Once used mainly in the manufacturing sector, workflows are now used everywhere from government agencies to retail.
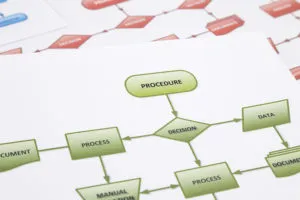
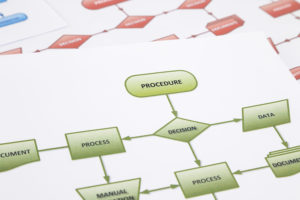
Workflows have been confused with flowcharts which are the actual illustrations of a workflow and a diagram used to depict a process. Often, the diagrams are designed to be easily understood using shapes such as ovals, diamonds, and rectangles. These shapes are connected by arrows to convey sequence and flow. In addition, they can be hand-drawn or digitally animated with multiple sequences and routes.
Flowcharts are commonly used by technical and non-technical people alike. Other names that have been used to describe a flowchart include process map, process flow diagram, activity diagrams, and process flowchart.
Benefits of Flowcharting
It’s important to visualize all the required steps of a task, and this is where a flowchart can help. Every flowchart is composed of specific actions, along with the people responsible for deploying those actions. There are also inputs and outputs. Here are a few other benefits:
- Transparency
One of the most significant benefits to flowcharting is the inherent ability to understand the workflow based on simple shapes and arrows.
- Prompt communication
Instead of holding drawn-out meetings, trying to explain every step in a business process – flowcharts can offer immediate clarity.
- Active coordination
For business process stakeholders and schedulers, a flowchart sequences events and helps to mitigate unnecessary tasks with the objective of time savings.
- Improve operational efficiencies
Flowcharts are a boon for efficiency as they list every single step needed to complete a process. At the same time, you can also remove steps and errors to make the process as efficient as possible.
- Effective evaluation
Using the visual representation a flowchart provides, problems can be analyzed more efficiently. Based on the symbols, viewers can see the beginning and end of a process, the point at which a decision must be made, and what actions are taken. A flowchart can also convey what data should be saved and how it should be stored.
- Solve problems quickly
With a flowchart, you can break down an issue into understandable parts. It makes any impending problem more distinct so that it can be addressed accordingly.
- Focus on strategy
As processes become more streamlined, both managers and employees can spend less time worrying about day-to-day operations and instead spend more of their time focusing on strategic work that helps to grow the business.
- Create an audit trail
Especially when using a software solution, records can be maintained digitally along with updates on progress and completion such as who completed the task, when it was completed, and if any modifications were made. This type of audit trail is useful for evaluating workflows and for regulation compliance.
When you use a flowchart, the goal is transparency. Terminology used in the flowchart should be kept as simple as possible to prevent any potential confusion. Then, it should be standardized and used consistently for optimum effect. Mapping out processes, and assigning owners, makes it much easier for everyone to understand their role.
Flowcharts are beneficial in any business sector since they can:
- Analyze processes
- Standardize business processes
- Help to determine bottlenecks
- Assist employees with understanding other components of the business
- Eliminate redundancy
Flowcharting in Industries
Now, let’s take a look at how to apply a flowchart in various industries.
Sales:
- Chart a survey
- Diagram the entire sales cycle
- Plot customer registration flows
- Organize a PR plan in the case of an emergency
- Convey research processes
Manufacturing:
- Convey the chemical and physical components of a product
- Diagram the initiation and ending of a manufacturing process
- Detail inefficiencies
Education:
- Detail required coursework and degree requirements
- Plot lesson plans
- Synthesize group projects
- Structure classroom processes
- Demonstrate steps of various experiments
- Clarify scientific processes
- Plot biological processes
- Explain theories
Business:
- Define procurement processes
- Chart an employee’s daily set of tasks
- Plot the customer journey
- Detail current business plans
- Document the steps needed to achieve regulatory compliance
- Showcase each component involved in a sale
Engineering:
- Convey a reverse-engineering workflow
- Design plant processes
- Coordinate a structure’s life cycle
- Design a prototype
When modeling a flowchart, you will have four components: Activities, actors, states, and results.
Actors include the employees who are responsible for specific tasks. Actions represent every step in the process. Activities describe the tasks that must be completed before moving on to the next step in the process. Additionally, each step has a “state” and an outcome, which are the results.
Documenting the workflow process is critical for project managers, professionals, and researchers alike because it offers a roadmap for the future, increases transparency and reproducibility, and allows for data analysis within the data lifecycle. For businesses, flowcharting is a critical component towards facilitating roadmaps, process transparency, process evaluation, and process reproducibility.
Symbols in a flowchart
When creating a flowchart, it is common to use four specific symbols – connected by arrows – to demonstrate sequence:
- Elongated circles are used at the beginning and end of a process.
- Rectangles signify actions and instructions.
- Diamonds emphasize when a decision must be made.
- Parallelograms are used to describe both input and output which can consist of materials, services, or employees.
Yet, there are other advanced shapes such as a rectangle marked with parallel lines on the side to identify a pre-existing workflow that has already been charted elsewhere. Moreover, a rectangle with squared top edges convey the start or finish of a repeated step within the business process. And, you can use a rectangle with a curved right edge to signify a delay.
It’s helpful to note that the flowchart should be kept simple to ensure you get the message across as clearly as possible. While you can use a multitude of various symbols, more isn’t always better or necessarily efficient.
Create the flowchart
You will have to draw the flowchart. How? Well, there are three common methods:
Take the manual approach using a pen and paper. This option is pretty straightforward, although it can be sloppy and time-consuming. You can also use intelligent business process management software (iBPMS) to create digital processes for a more detailed evaluation of your workflows – complete with automated process execution.
Now it is time to finally create your flowchart using the following steps:
- Identify all tasks
Break down every task in a business process based on chronological order. What happens along every point? Does a decision need to be made, or are approvals necessary to move on to the next step? Think of the employees who will initiate the process for the first time. How can you plot a flowchart for novices that would be easy to understand? Check to make sure every stakeholder can comprehend the shapes and sequences.
- Organize every task
Next, start your flow chart by drawing the elongated circle shape and labeling it “Start.”
Draw the elongated circle shape as the starting point. Next, go through the full process. Document every action in order. Use arrows to connect the shapes and to portray the flow. When a decision needs to be made, draw an arrow towards a decision diamond with each potential solution. Then, classify every arrow with the specific decision made. Use the elongated circle shape once more at the end of the process with the word, “Finish.”
- Test the process
Once you have created your flowchart, it’s time to test its validity. You want to ensure you have not missed any steps and that they are sequenced correctly. Are all the decisions accurate? Are there other decisions that should be designated? You also want to share your flowchart with other stakeholders to receive their feedback. This is the time to correct any omissions or issues.
- Use the flowchart to evaluate workflows
Now that you have your processes documented, you should always look for areas to improve through thorough evaluation. Are there any steps that are unnecessary and should be removed? Are there any missing steps that should be added? Are there bottlenecks that can be addressed and removed? Are the right stakeholders involved? Are there tasks and decisions that would benefit from automation? Make the necessary changes, and continue to use your flowchart to evaluate workflows. Remember, this may take time. Don’t set far-fetched expectations of changing processes and habits overnight.
Start with powerful, automated workflows
Invariably, you need to consistently evaluate your workflows to determine opportunities for improvement. Drawing the flowchart is just the start. Once you have created your shapes and sequences, you want to utilize an automated platform that removes the friction between your business tools and processes to induce seamless collaboration. Build automated approval processes without any complex coding required or assistance from the IT department. Immediately, you can achieve significant business process improvements through automating tasks, decisions, and approval requests.
The post How to Evaluate Workflows by Flowcharting appeared first on ProcessMaker.