How to assign dashboards
Blog: Aris BPM Blog
Today, I want to show you how you can assign dashboards you have created to different areas in ARIS Connect.
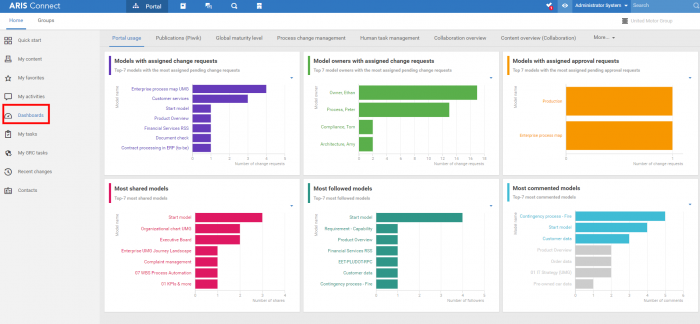
The first area is “Home”. This area is suitable only for dashboards that are not context-sensitive and usually shows general/overall information. If you have configured multiple dashboards, you can switch between dashboards in the tab bar above the dashboard.
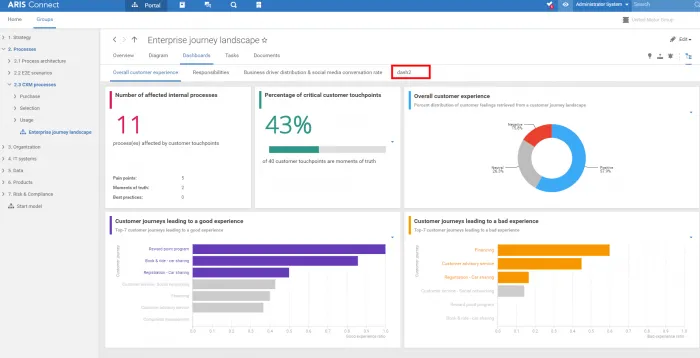
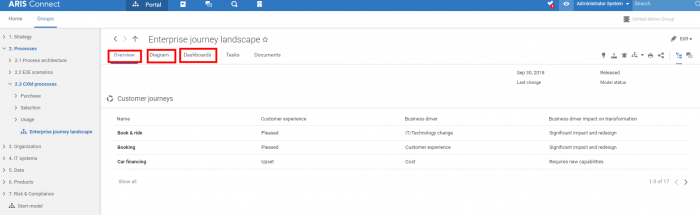
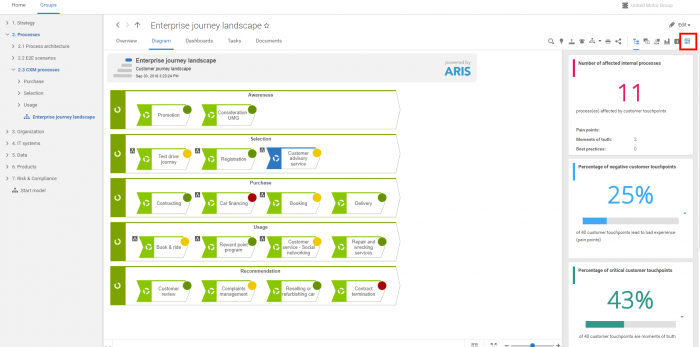
There are three areas where it is possible to connect dashboards with ARIS data in a context-sensitive way: the “Overview”, “Diagram”, and “Dashboard” tabs.
One option for showing a dashboard is the side-by-side view where you show the model on one side and the dashboard data on the other. You can use this functionality to obtain context-sensitive information. Clicking a single object enables you to view information on that specific object only. Please note that this works only if you have specified during dashboard creation that your dashboard will be context-sensitive.
How to configure a dashboard for the “Home” area
In ARIS Connect, go to Administration > Configuration > Portal > Manage configuration sets.

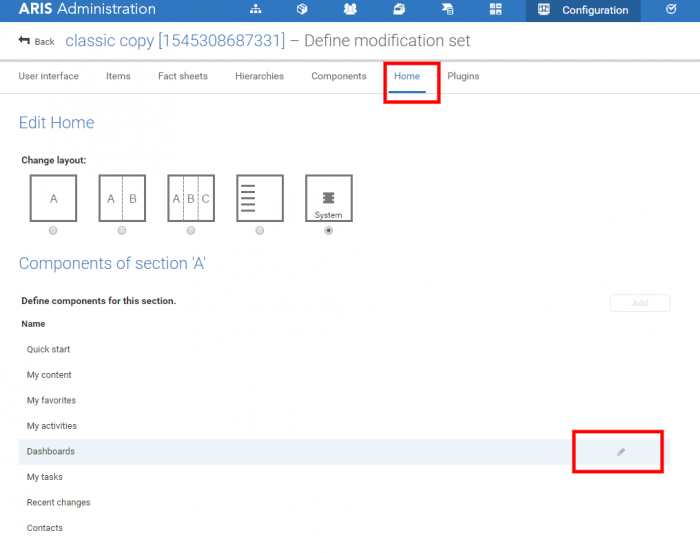
Choose one of the sets and click the “Edit” icon at the end of the row. Then choose the “Home” tab and select “Dashboards” as the component. Click the “Edit” icon at the end of the row again.
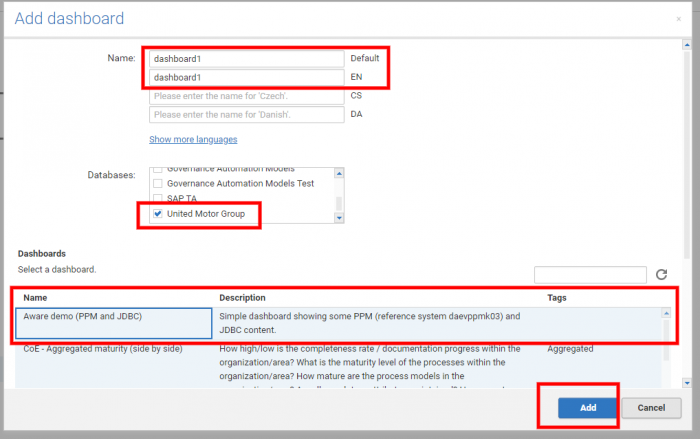
Click the “Add” button in the dialog that opens. In the "Name" field, you have to specify a default language and at least one more language, for example, English. You can choose whether you want to configure the dashboard for all available databases or for a specific one only. Select the relevant dashboard and click “Add”. Your dashboard is then displayed in the list of dashboards.

How to configure a dashboard for other areas
Choose the “Fact sheets” tab in the selected modification set. From the list displayed, choose the item which you want to configure your dashboard and click the “Edit” icon at the end of the row.
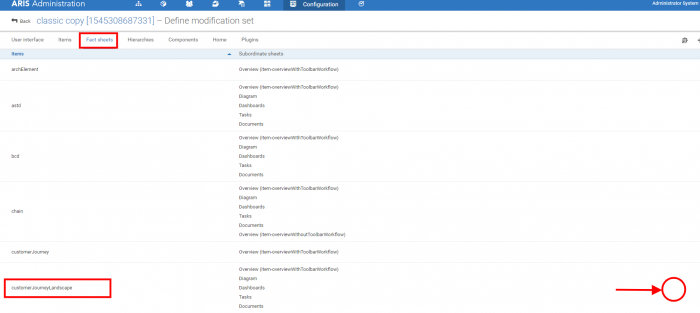
The other areas where you can configure a dashboard are displayed: “Dashboards”, “Diagram”, and “Overview”.
Choose, for example, “Dashboards”, and click the “Edit” icon at the end of the row. On this page, you can add, remove, or edit dashboards. You can do the same for the areas “Overview” or “Diagram”.
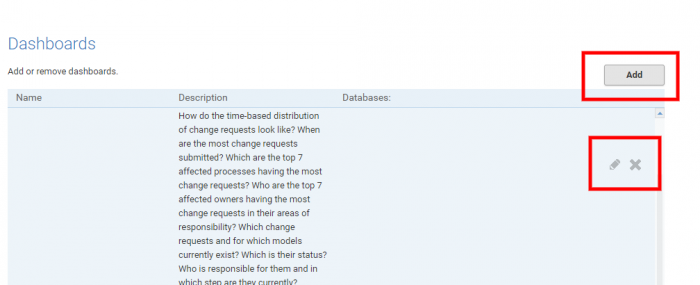
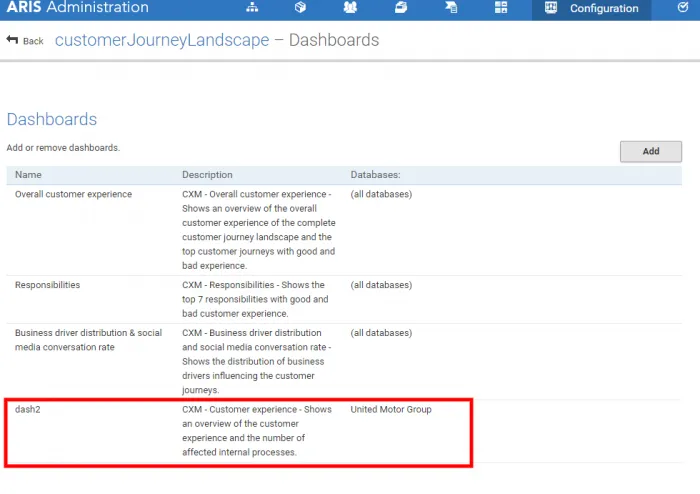
If you choose to configure a new dashboard, click the “Add” button. A dialog will open and you have to enter the name (at least in 2 languages), select the databases, and select the relevant dashboard.

Click “Add”. Your dashboard is now displayed in the list of dashboards.
When you exit the "Administration" area and go to the factsheet where you configured the dashboard, you can see that your dashboard was added as a new tab.