
How to analyze the customer experience of your company using ARIS Aware
Blog: Aris BPM Blog
Today I want to show you how ARIS Aware can assist you as a person responsible for customer experience management in performing your tasks, i.e., in finding out how customers experience their interactions with your company. This can be done by obtaining answers to the following questions:
- How satisfied is the customer?
- What journeys does the customer take with your company?
- What business units and channels are responsible for the customer touchpoints in your company?
- How many customer touchpoints and how many of them are moments of truth, pain pointsand/or best practices?
- ....
To help you answer these questions, ARIS Aware provides you with predefined dashboards that you can use to analyze your customer experience models.
To get a first impression of the customer experience, you can use the side-by-side view showing the customer journey landscape model on one side and the dashboard data on the other. This enables you to show the percentage distribution for the customer touchpoints that are to be considered negative, critical, and positive. Furthermore, if you select a specific customer journey object, the dashboard will provide you with information on the corresponding customer journey only. This functionality enables you to obtain context-sensitive information and supports you in finding out how the customer experiences the various customer journeys.
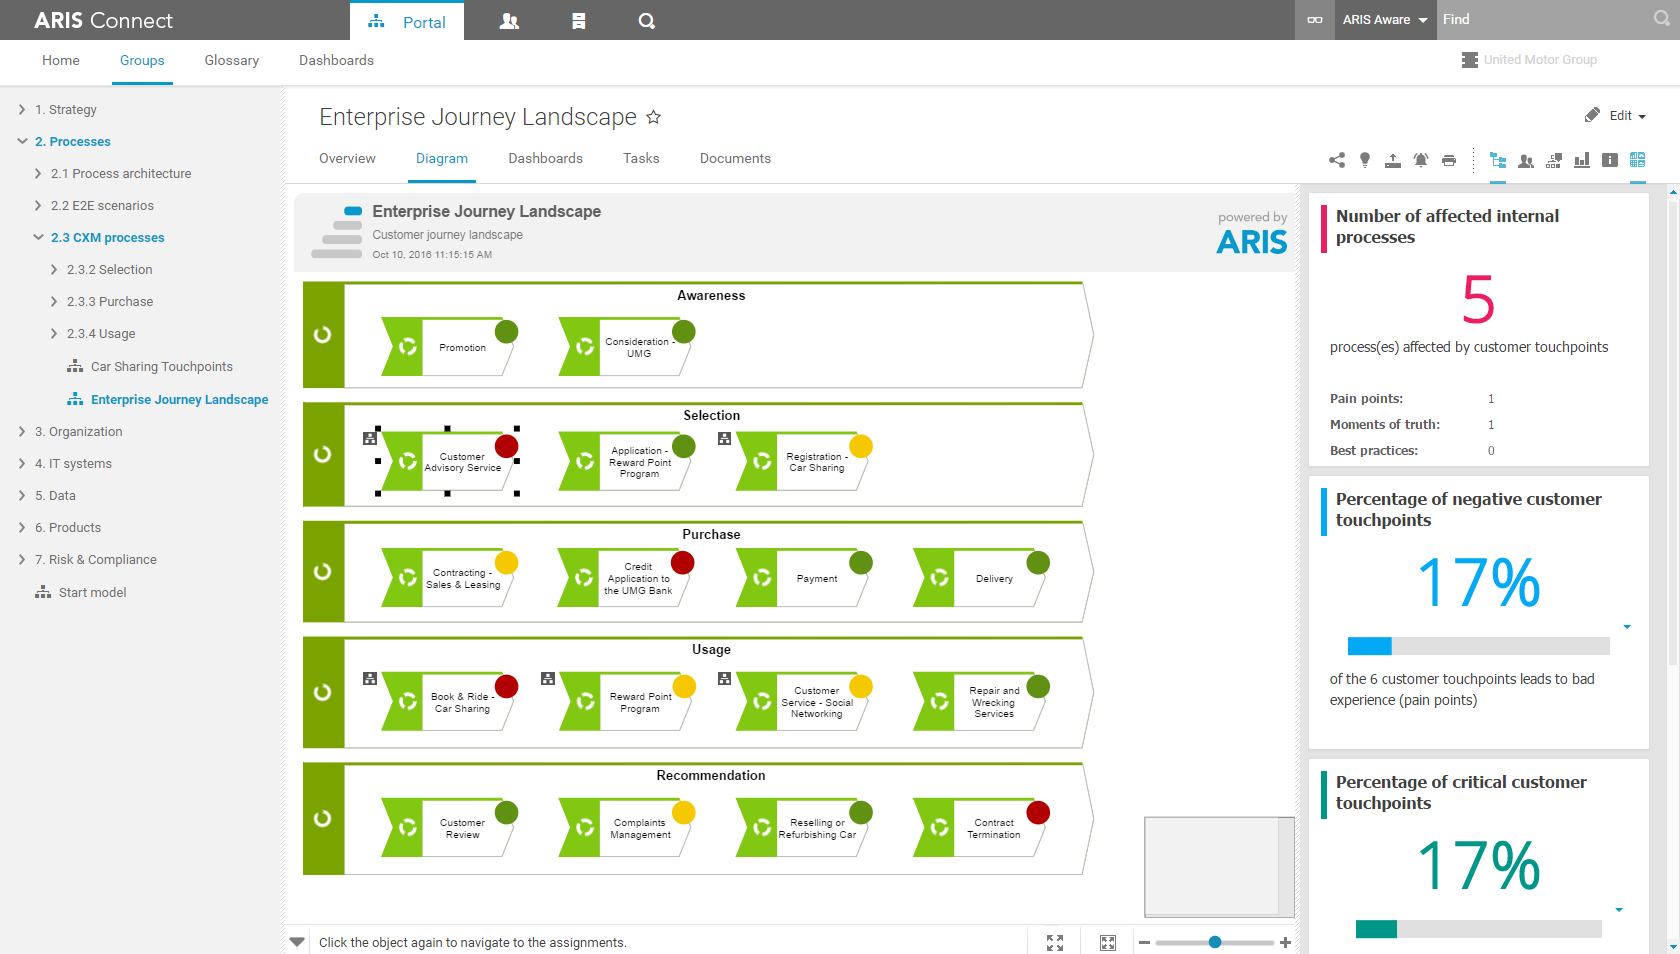
But that's not all! :) Under the dashboard tab, you can find three other dashboards with more information.
The first dashboard offers an overview of the overall customer experience. It includes, among other things, the aggregated number of critical touchpoints of all you customer journeys that are implemented in the customer journey landscape. It also shows the customer journeys that result in a bad customer experience. The corresponding chart tells you which customer journeys are critical. You can use this information to find out the reasons. You can click the bar of the relevant customer journey to navigate directly to the corresponding critical customer journey where you can find more details.

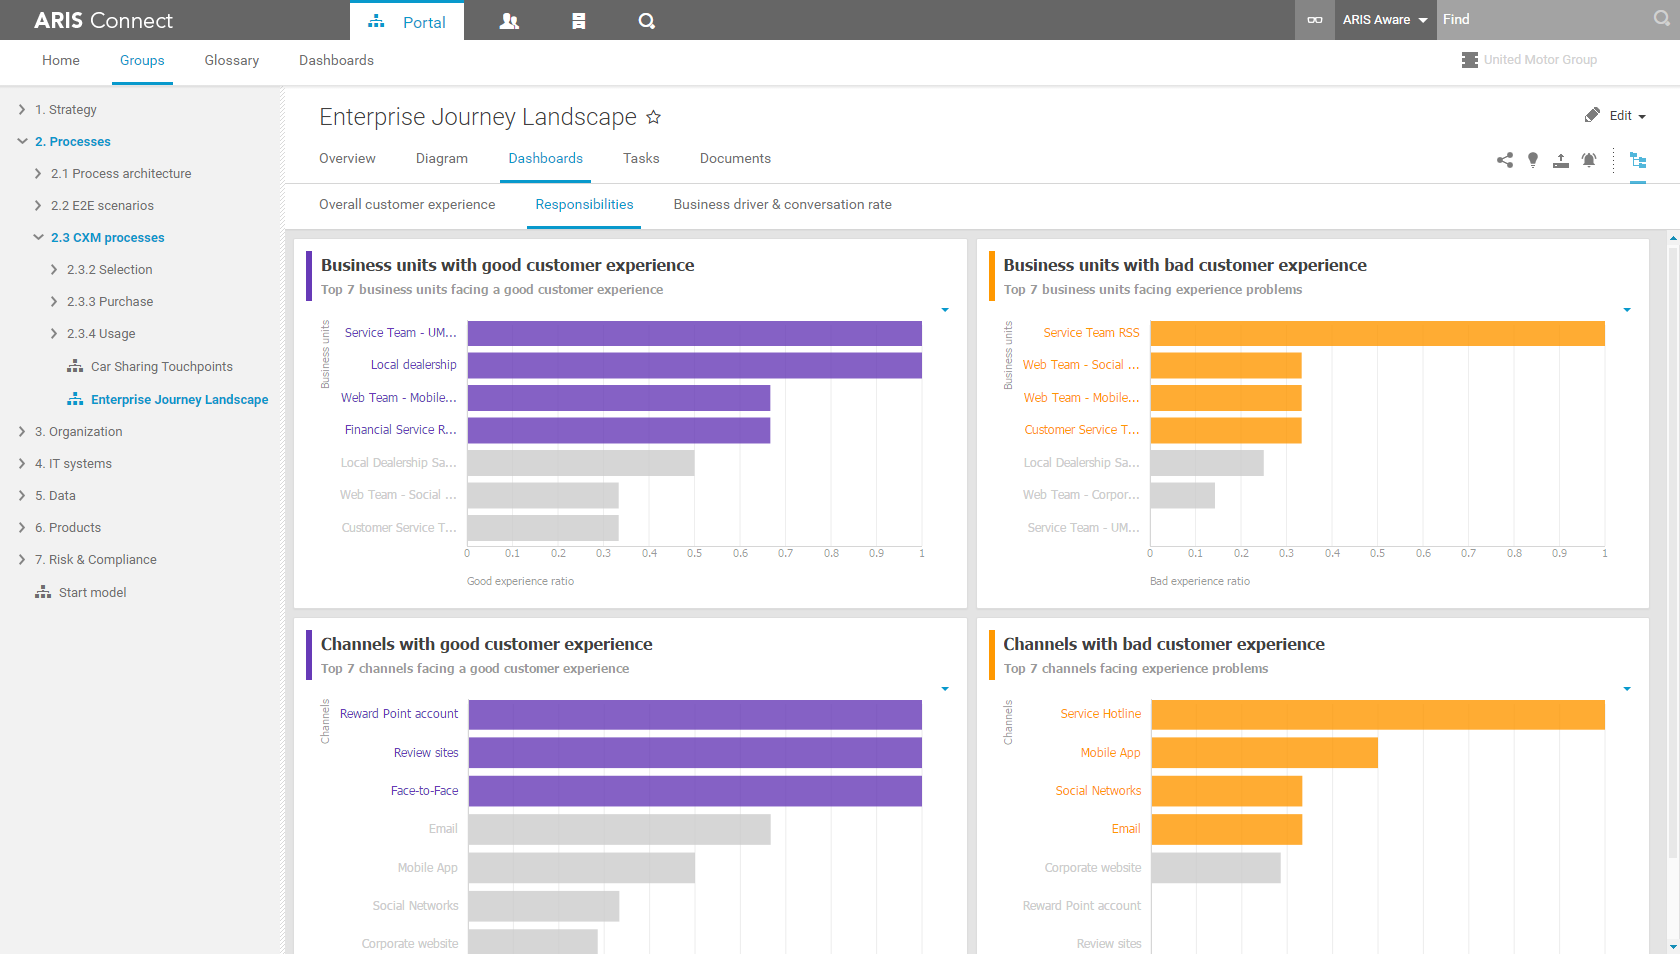
The second dashboard identifies the business units and channels that are responsible for the various customer touchpoints, as well as the quality of the experience (good/bad). With this information, it is possible to further assess what exactly the reasons for the bad experience are, e.g., too many customer requests and insufficient resources in the business unit.
Last but not least, there is a third dashboard that you can use to find out the percentage distribution of business drivers influencing the various customer journeys. The social media conversation rate chart shows you how to use ARIS Aware to combine data coming from different sources.

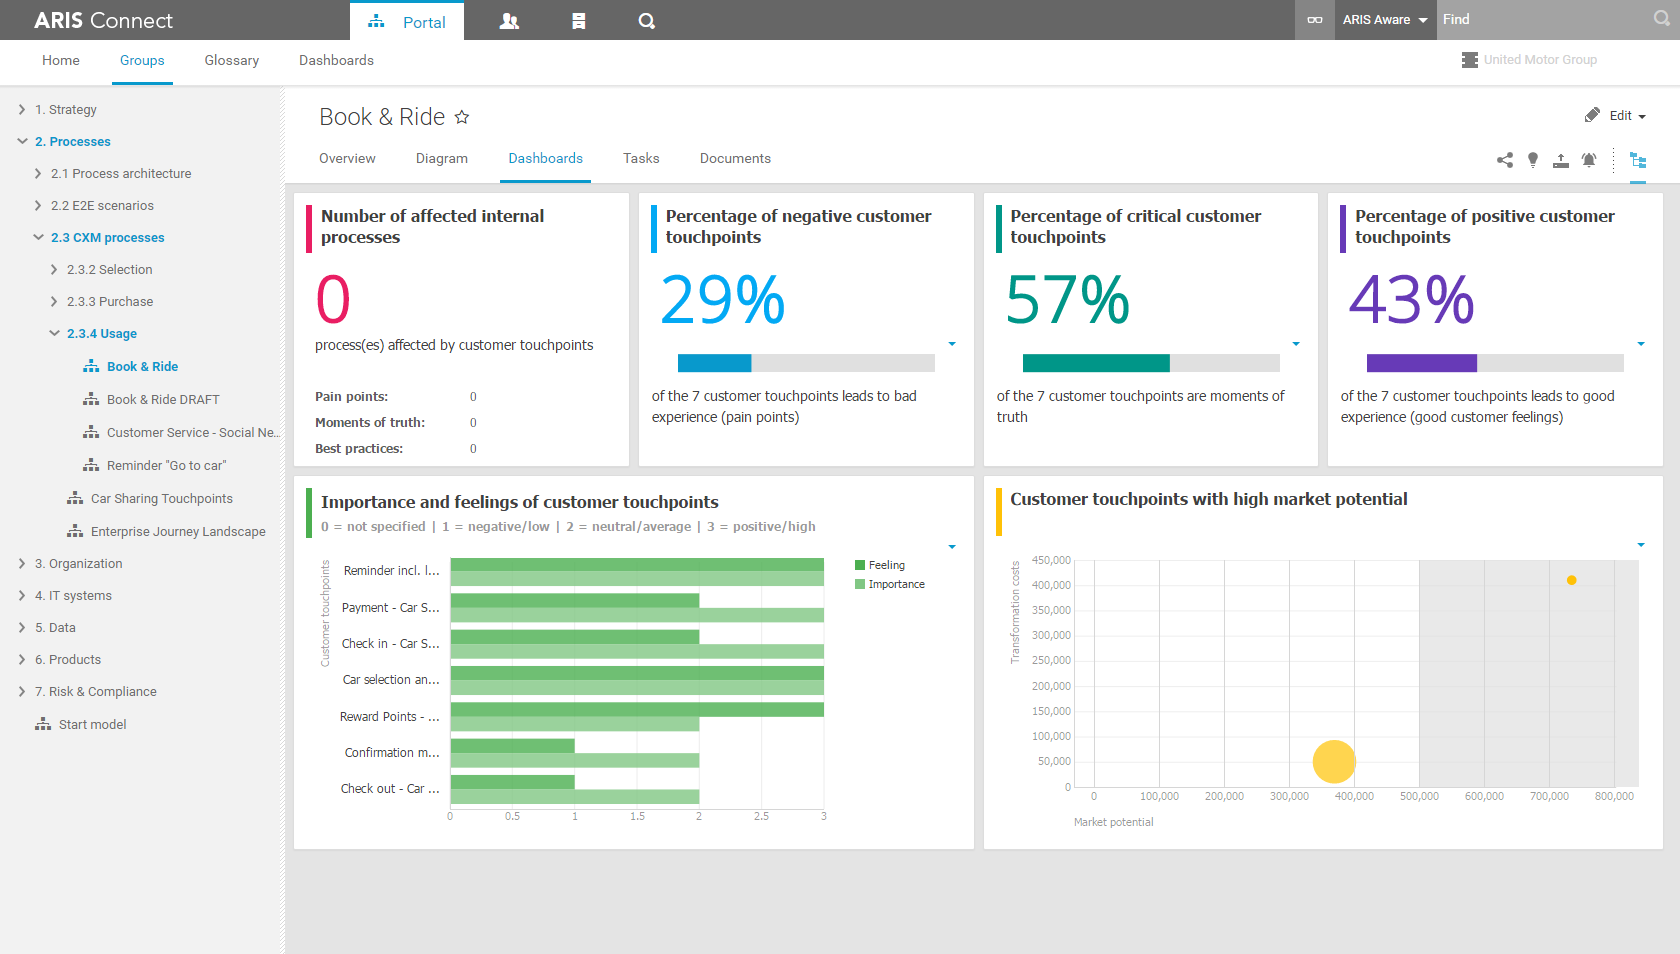
A dashboard is also available for customer journey maps. This dashboard shows all details related to the customer journeys in your landscape, including information on the customer touchpoints, for example, a comparison of the customer feeling pertaining to a touchpoint with the importance that this touchpoint has to the customer.
This dashboard also identifies customer touchpoints that have a high market potential combined with low transformation costs. These touchpoints are the most important ones to be worked on if you want to improve the experience of your customers with your enterprise with a manageable effort.
I hope to have provided you with some interesting information. There is more to come, so stay tuned! :)
To obtain further information, you can subscribe to the “ARIS Aware” and “Customer Experience Management” tag.