Decline Curve Analysis with TIBCO Spotfire
Blog: The Tibco Blog
Decline curve analysis (DCA) is a graphical procedure used for analyzing declining production rates and forecasting the future performance of oil and gas wells. Fitting a line through the performance history and assuming this same trend will continue in the future forms the basis of the DCA concept.
Decline curves are based on exponential, hyperbolic, or harmonic Arps equations, but tend to have limitations such as underestimating reserves, underestimating production rates, or overestimating reservoir performance. Decline curve analysis was performed on semi log papers before the computer age. DCA is still popular since the curves are easy to plot, analyze, and yield results on a time basis.
You can find a data function that calculates a hyperbolic decline curve analysis using production oil and gas data on the TIBCO Community Exchange.
The data function accepts two input columns:
col.Date – column of date values for production (production date)
col.Production – column of integer number values indicating production
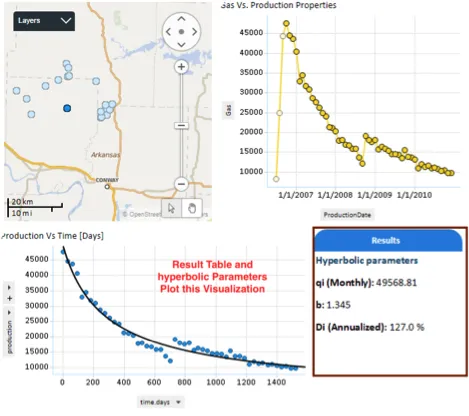
The Outputs of data function are four values and result table
Hyp.qi:qi coefficient for the Hyperbolic fitting expression
Hyp.b : b coefficient for the Hyperbolic fitting expression
Hyp.Di.daily : Di coefficient for the Hyperbolic fitting expression (per day)
Hyp.Di.annual : Di coefficient for the Hyperbolic fitting expression (per year).
result : Production normalized per production days
Want to use decline curve analysis with your data and dashboards? Learn more about TIBCO Spotfire and give this trick a try with a Spotfire free trial!