
Datathon Winner: Best Analytics Visualization Using TIBCO Spotfire
Blog: The Tibco Blog
Oil and gas and energy professionals came together this summer for an amazing, data-driven event. Untapped Energy and the Society of Petroleum Engineers (SPE) organized and hosted an incredible event, the DUC Datathon a.k.a. Drilled but Uncompleted Wells Datathon. Bringing together hundreds of students and energy professionals, participants gained access to virtual sessions, data bootcamps, and lively competitions.
TIBCO was excited to sponsor the event and provided free access to TIBCO Spotfire®, an advanced analytics tool that is very popular in the global energy sector. Our very own Michael O’Connell, TIBCO Chief Analytics Officer, kicked off the competition with a fantastic keynote.
We even had a competition of our own! Worthy competitors went head to head to create the “Best Visualization Using TIBCO Spotfire.” There was no shortage of creativity and talent, but in the end only one champion could be crowned for their outstanding efforts: Dean Udsen. Udsen is an accomplished data and analytics consultant in the energy space. Over the last decade, he has been widely recognized for his efforts with TIBCO customers.
Udsen decided to join the Datathon to stay busy, motivated, and continue his learning this summer. And his enthusiasm paid off, winning him a pair of Bose 700 headphones. There’s a lot we can learn from Udsen’s success. Below we’ll take a look at a few examples of how he helps TIBCO Spotfire customers in Western Canada create real business value.
Providing Value to Customers
Udsen’s success is based on his core best practices: It’s essential to have a deep understanding of your clients’ goals and ensure you’re working towards a common objective. It’s also important to work with the client team at their comfort level. Some organizations are experienced and ready to move quickly. Others take time to ramp up their capabilities and develop trust in the analytics.
Udsen believes that integrating data is the “secret sauce” for all organizations to identify ways to improve their efficiency and effectiveness. By providing advice and experience on how to pull the data together, he helps clients quickly build dashboards that are providing the business with real value.
Today, there is often an impulse to either build everything all at once or to build all the backend components to support all potential processes before an end-user sees anything. But, according to Udsen, it’s better to start with one or two business processes and build them from beginning to end. This gives end-users something to start working with, shows them the potential, and allows the team to learn as they go. Plus, you gain immediate value as clients use the new process quickly to help make business decisions.
It’s important to not employ technology for the sake of technology. In a very price sensitive environment, you need to implement tactical projects that provide an immediate benefit. First, understand what is the most important issue for the client, and then look for the quickest way to improve.
Now, let’s look at a few customer examples from Dean Udsen’s past projects:
- Radical Improvements in Time to Acquisition Analysis: One client wanted to improve their acquisition process and significantly decrease the amount of time needed to perform analysis. How accurate were their forecasts for price, production volumes, revenue, etc. in comparison to the reality of what happened in the ensuing years? They built the dashboard below using Spotfire to combine data from public data sources, internal accounting, and forecasting software. It allows the team to quickly and easily compare the forecasted vs. actual data of any acquisition.

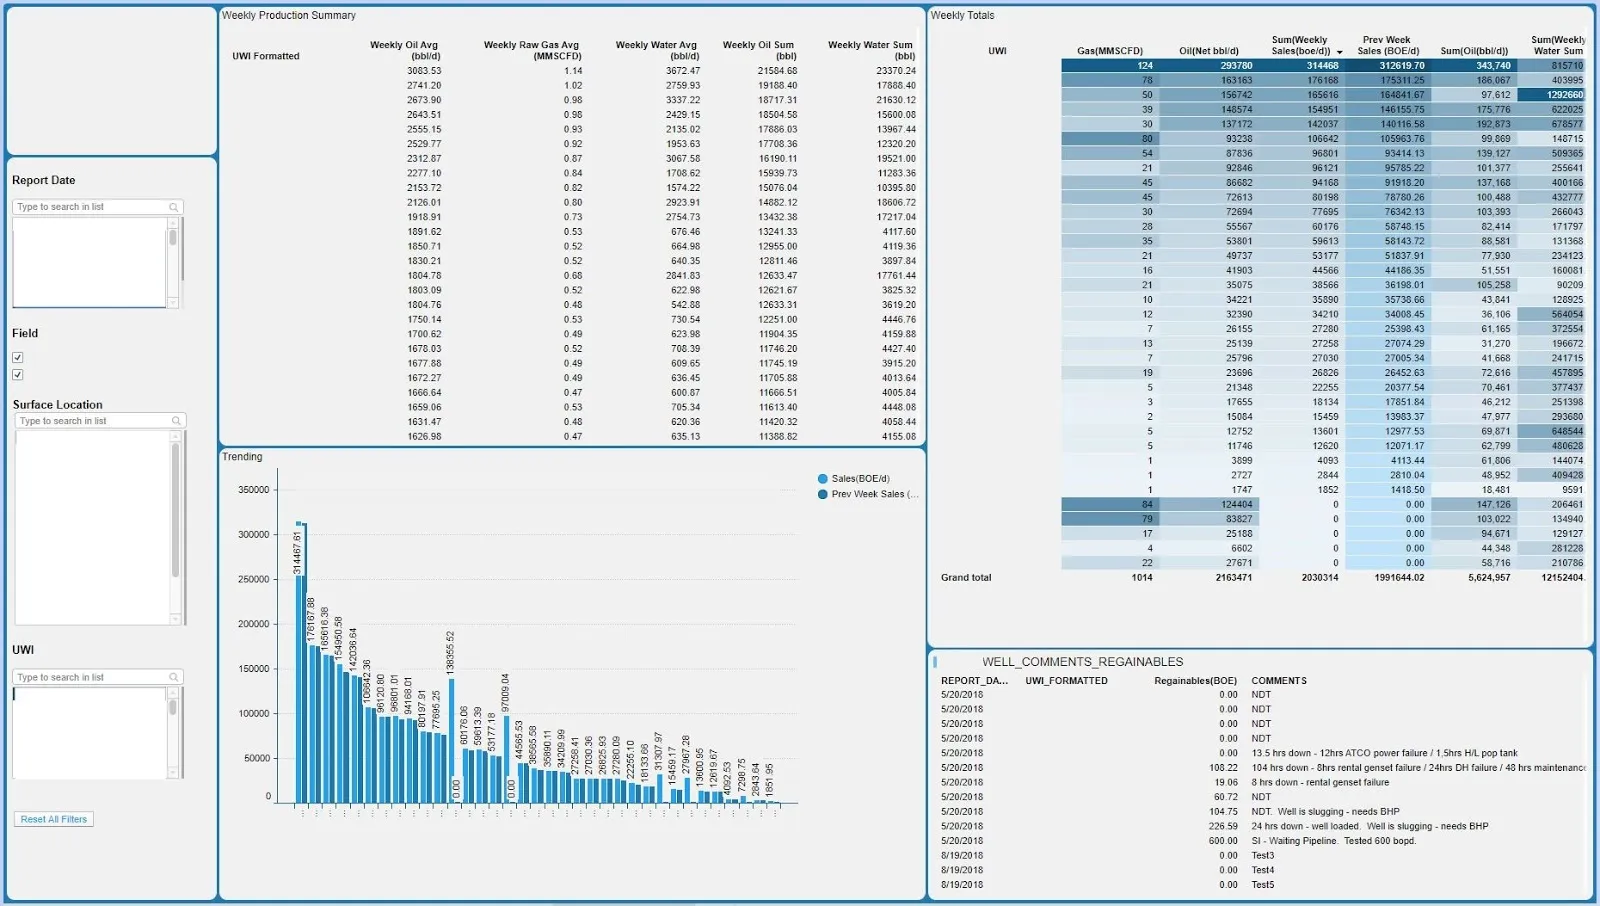
- An Evolution in Weekly Production Reporting to Immersive, Real-Time Reporting: In the past, another client of Udsen’s met each week to compare weekly production using print out hard copy reports for each well. Now, with a new dashboard built using Spotfire (pictured below), the team has an automated way to review the data. The team can select the report week, group wells by their pad location, and investigate individual wells in real time. They can easily compare wells and pads to each other, and the amount of time required to prepare for the meeting is now zero. The data is available on demand without having to wait for the reports.
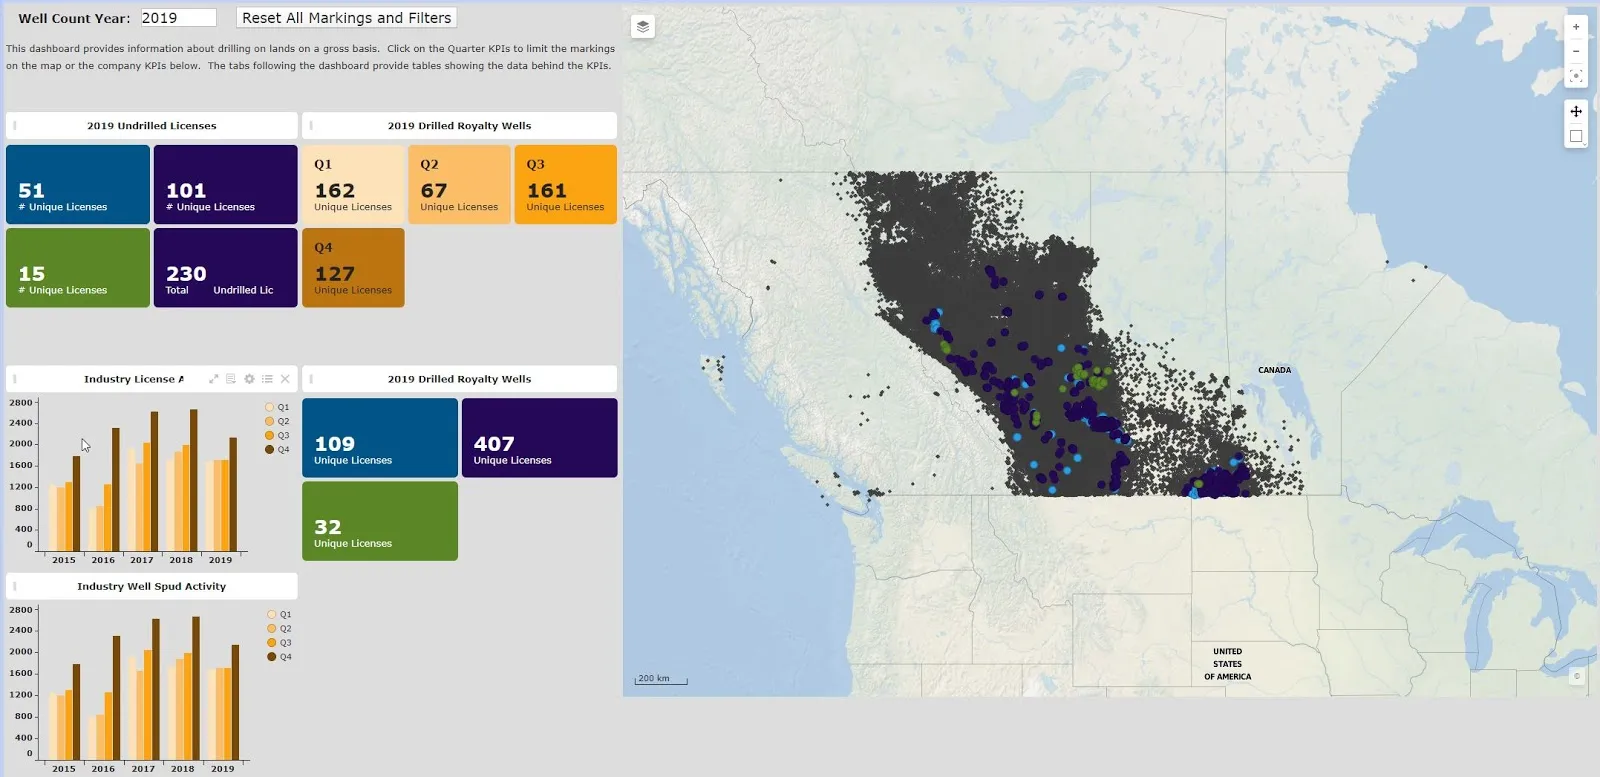
- Faster Well Counting, from Weeks to Hours: Another client previously used a quarterly report process to review industry activity and predict how many wells would be drilled on their royalty lands. This process took weeks to complete each quarter. The dashboard below, again built using Spotfire, speeds up this process greatly, allowing the team to get updates every day and see up to the minute activity and expected well counts as they occur. It combines data from a number of sources including public data, land, and GIS data to automatically determine which wells are “on the lands” and whether the expected drilling matches the company’s mineral rights.
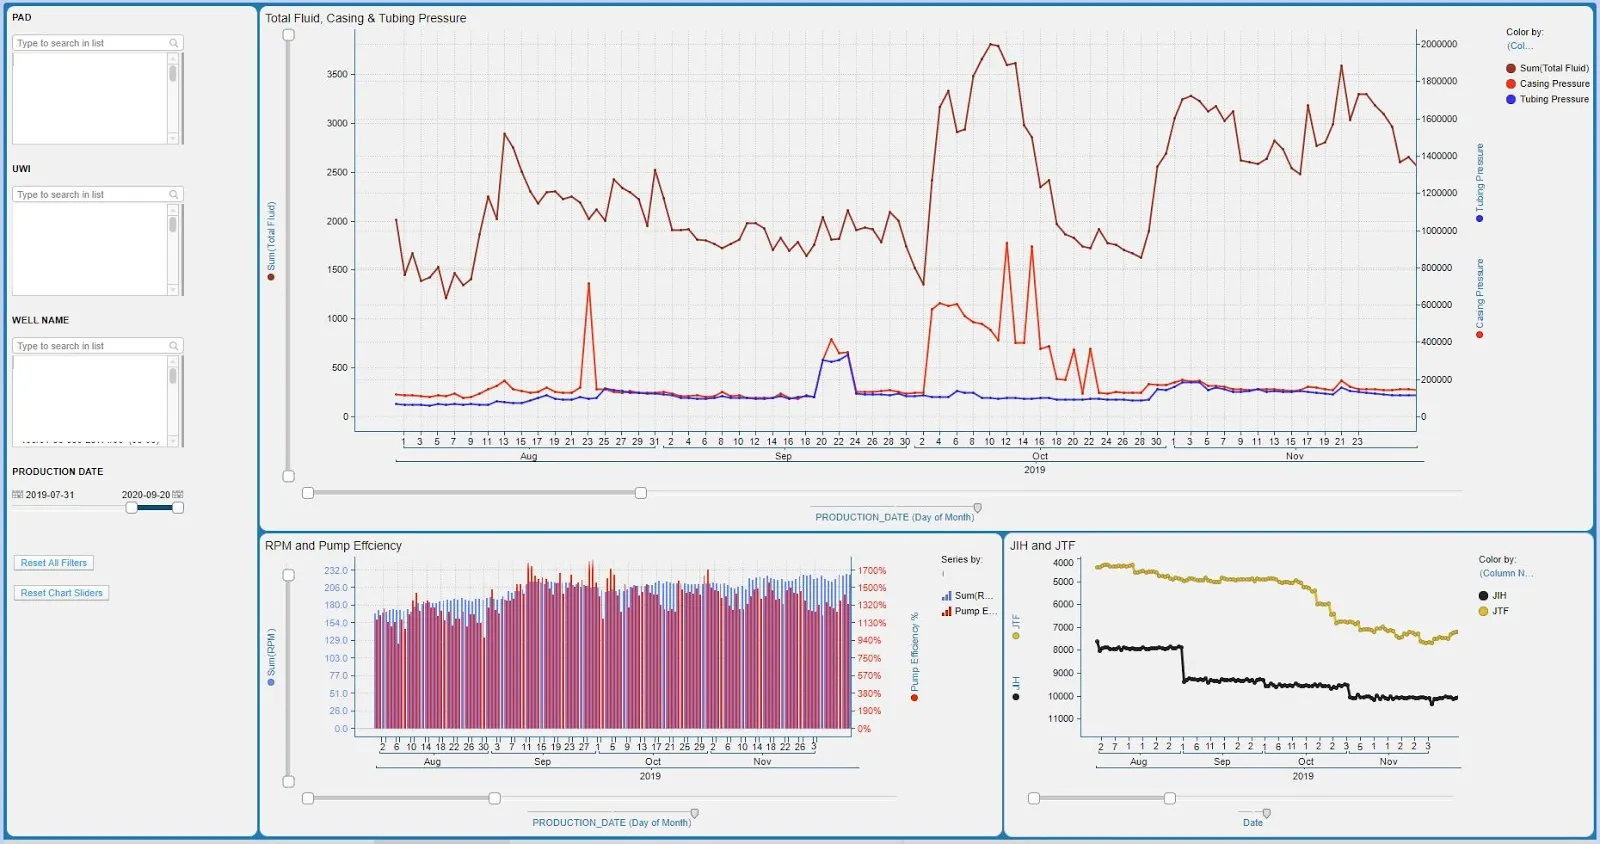
- Deeper Insights into Well Operations: Engineers at one company needed a quick way to combine data between their production, accounting, and drilling applications. A quick look at each well was needed to ensure optimal performance and that costs were being contained. Working with the engineers, a number of charts were developed using Spotfire to meet this need, looking at the physical operations of the wells, along with the production and sales revenues. See example below:
Get started with TIBCO Spotfire
These are just a few examples of the successful use cases saving Spotfire users time and money. In fact, according to one customer:
“Spotfire enables us to bring together several disparate data sets, both internal and external to the company. We can then visualize relationships and develop insights about our business, without spending most of our time collecting, curating, modifying and combining data. The results are easily shared, and often generate new ideas that lead to even further leverage of our data, and impact the strategic activities within the business.”
It’s essential to have a deep understanding of your clients’ goals and ensure you’re working towards a common objective. It’s also important to work with the client team at their comfort level.
Click To Tweet
Interested in implementing any of the use cases mentioned above or others? Implement TIBCO Spotfire and enable everyone to visualize new discoveries in your data, quickly and easily.