Data versus information—using Power BI and Dynamics GP together
Blog: Professional advantage - BPM blog
Business systems are complicated beasts
Business Management systems like Microsoft Dynamics GP are complicated, detail driven systems; they have to be, because they do complicated, detail driven jobs. They often present masses of information on screens full of data that can be meaningless to those not initiated into the wonders of ERP or CRM systems.
People who use them regularly, love them
If you talk to people who use tools like Dynamics GP regularly, for their jobs—like purchasing managers, accounts staff, goods inwards inspectors, and inventory controllers—they will usually tell you that the system works well. It does exactly what they need it to do. They say this because they know exactly which bit of the system to use and how to use it, and they work in the detail.
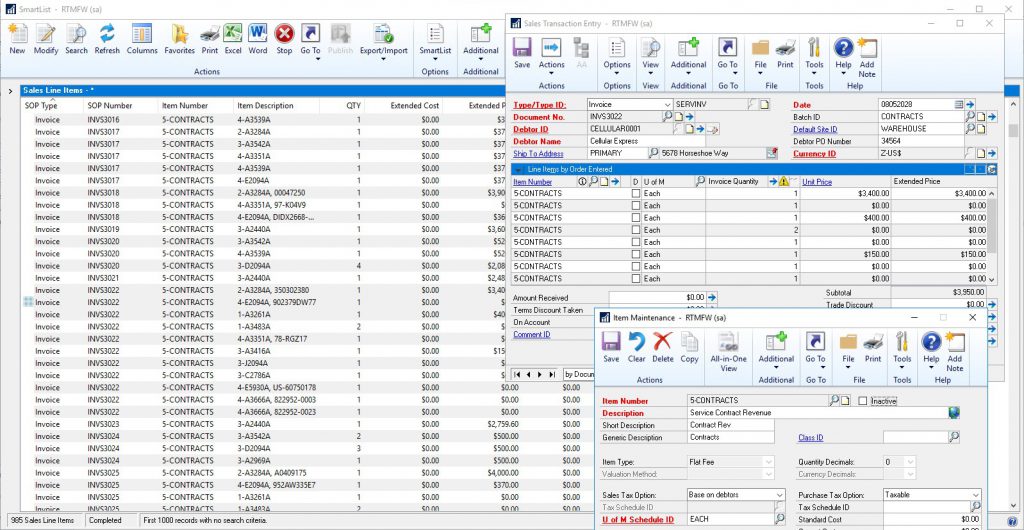
People who don’t use them much, don’t love them
If you talk to people who are trying to get a top-down view of what is happening in the organisation, the story is often entirely different. Their feedback differs, but almost always includes the word “complicated” and themes around how hard it is to find the information they need. The problem is that they’re blinded by data: numbers, numbers everywhere and no ideas to think.
There IS a solution
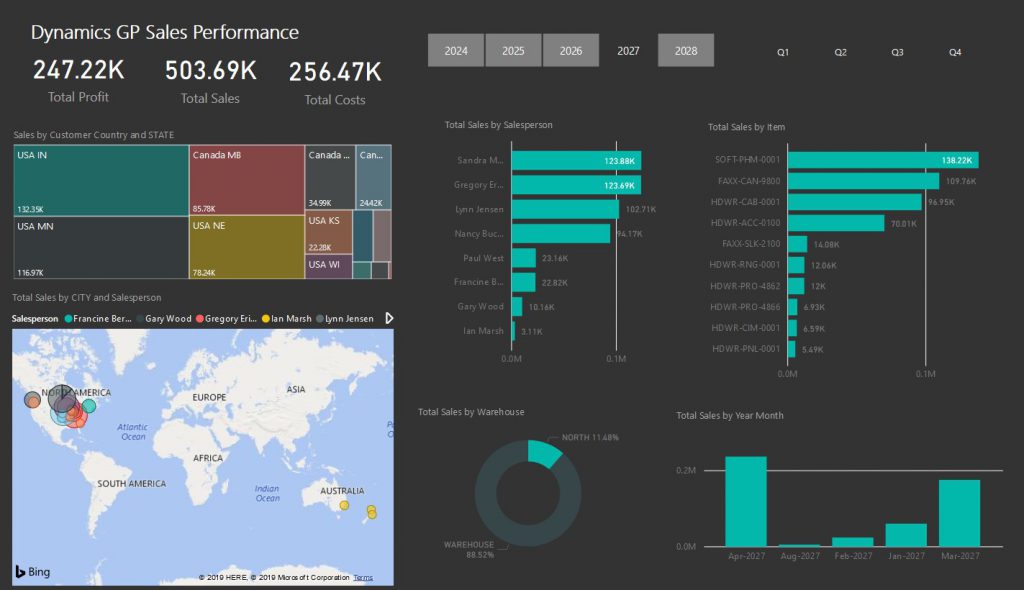
Management and analysts need a tool to aggregate and process the data in the system to present them with an easily digestible top-down view with charts, graphs, and KPIs.
Power BI is that tool. It’s more than just graphs created from data in Excel; it allows you to build and save dashboards and views that give management the essential top-down view of the enterprise that it needs to understand what is happening in the business. Further, the advanced Artificial Intelligence features of Power BI automatically generate insights from your data and allow the creation of visuals using natural language queries.
You can even set up the dashboards to work in real time, or semi-real time by updating at intervals throughout the day, essential in fast-paced industries like FMCG, or to fine tune just-in-time inventory controls on speedy production lines.
Reasonably priced and easy to set-up.
Power BI costs nothing to get started: users only need a licence to collaborate with others and, even then, it costs less than a daily coffee per user.
Most users find the drag and drop interface easy to use and can create the reports they need by themselves. They generally don’t need a consultant to get involved until they want to create automated processes or complicated SQL queries.
How you can get started with Power BI
It’s as easy as downloading the app to get started with Power BI. There is even a mobile option, for people who are not desk-based, or who need their information on the road.
Add-on modules increase the functionality. Microsoft Power BI Publisher for Excel allows you to export data from Excel—like charts, pivot tables and cell ranges—to your Power BI web dashboard to improve your visualisation of data. And you can even use Power BI Report Server to distribute traditional paginated reports within the boundaries of your organisation’s firewall.
Embrace the power of knowledge
It’s easy to forget that the base reason people implement systems like Dynamics GP is to organise and understand their businesses better. Management systems like this facilitate just-in-time inventory control, streamline purchasing, and supplier qualification, and they collect data that we can use to understand what is going on inside the systems.
But that data becomes blinding unless we can use a tool to sort it, filter it, and present it in a digestible form. Excel goes only so far and then we need a tool like Power BI to give us the essential top-down view that management is looking for: tools that turn data into information.
And when we add that information to what we already know from our business and other sources, we generate actionable knowledge—the knowledge we were seeking when we started on the journey to understand our organisation better. And that knowledge gives us the power and commercial edge to improve what we do and edge out our competitors.
Learn more about Power BI and how Professional Advantage can help you here.
- If you would like to know more, complete the form below and one of our experts will contact you.
-
-
We would like to send you occasional news and relevant marketing communications. To confirm you would like to receive these communications please check the box below. You can unsubscribe at any time.
- Your information will never be shared or sold to a 3rd party. Please see our privacy policy to learn more about how we use your data.
This iframe contains the logic required to handle Ajax powered Gravity Forms.
The post Data versus information—using Power BI and Dynamics GP together appeared first on Enterprise Software Blog – Professional Advantage.
Leave a Comment
You must be logged in to post a comment.