
Data Requirements for New IT systems
Last week, we had our first Process Mining Café and it was great! Together with Gijs Eerdmans and Erik Rootjes from Vivat, we discussed which data properties you need to ensure in a new IT system if you want to make the data suitable for process mining. If you missed the café last week, you can now watch the recording here.
Vivat had recently introduced a new BPM system to improve the handling of their insurance processes. The main goal was to reduce costs by reducing manual handling time. However, the introduction of the new system also gave Gijs and Erik the opportunity to influence what data would be collected. Gijs and Erik are operational excellence consultants and Lean Six Sigma Black Belts at Vivat. They are responsible for process improvement projects at the company and, therefore, need good data for their analyses.
Some of you may be in a similar situation in the future. Then, which data properties exactly will you need to ensure in the new system? Gijs, Erik, and I made a checklist for you, so you don’t forget anything essential. And even if you are not introducing a new system any time soon, the checklist can give you some tips for how you might improve the data collection in your current system if you get the chance.
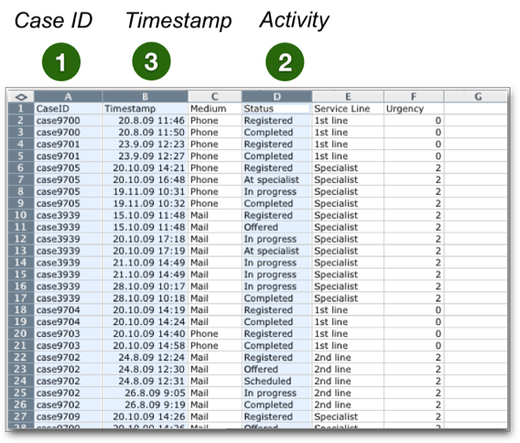
Of course, first of all, you need to ensure that the minimum data requirements are fulfilled. For any process mining analysis, you will need (1) a case ID, (2) an activity name, and (3) at least one timestamp. If you are new to process mining, read our introductory chapter about the data requirements here.

However, there are a few additional points you should consider if you have the chance to influence the data in your IT system.
1. All relevant activities
In their old system, Vivat had the problem that they only recorded the No. of resolved cases, the No. of Full-Time Employees (FTE), and the start and the end date per case. So, they could only compute the average process time and the average number of cases per FTE. They could not perform any deeper process mining analysis.
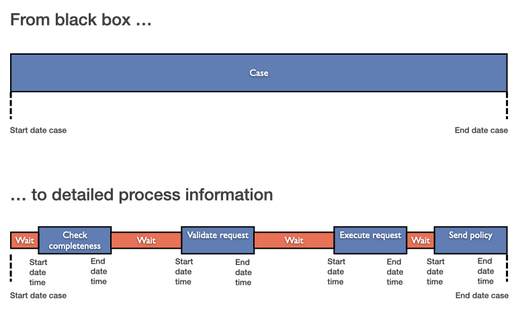
In the new system, they made sure to record all the intermediate steps of the process in a very detailed way (see the illustration above).
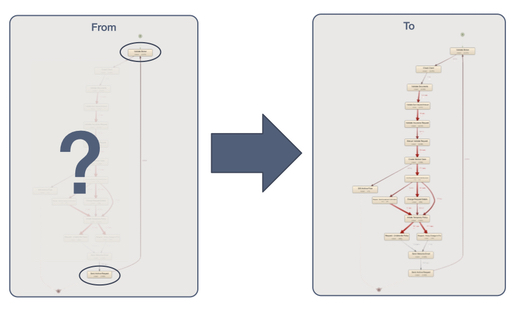
As a result, they went from a “black box”-like situation of no visibility besides the start and endpoint of the process (see left side in the illustration below) to full visibility of all the activities in the process (see right side below).
Now, this is an extreme situation but even if your current system already records some of the activities, you might have some blind spots. Activities may be taking place in a different system to which you don’t have access. Or there may be manual activities that are not visible in the data.
When you have such blind spots, the most important thing during the process mining analysis is to keep in mind that these blind spots are there.
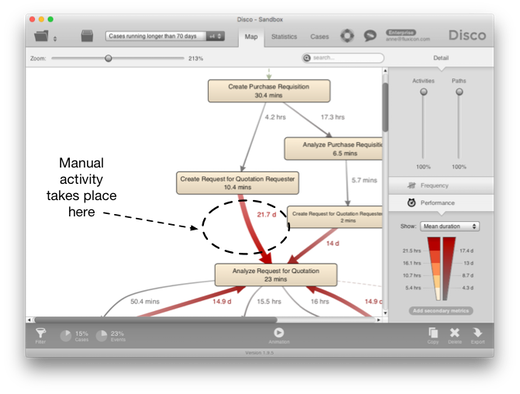
For example, in the process map above, we know that the 21.7 days average waiting time are not completely idle, because manual activities are taking place that we just can’t see. So, we need to take this into account in our interpretation (see this guideline on missing activities for more information about how to deal with such blind spots).
However, if you have the chance to add missing activities to your data for good then this will clear up these blind spots and improve your analysis. So, think about which activities are relevant for your process and make sure that they are recorded.
2. Start and end timestamps
While one timestamp is enough to perform most process mining analyses (see also our data suitability checklist here), it is definitely worthwhile to include more detailed timestamp information if you can.
The advantage of having not just one timestamp per activity (e.g., the time of the completion of the task) but two timestamps for both start and completion is that you can differentiate the active times from the waiting times in the process (see illustration below).

This differentiation is necessary for utilization analyses and for most resource- or activity-based cost analyses. For example, for Vivat the activity durations were really important, because they wanted to know the costs per customer request and analyze where in the process they can improve. So, they made sure to include both the start and the completion times of all activities.
You might consider adding even more detailed timestamp information, such as the scheduling of a task. This will allow you to explore different perspectives like the time from availability to completion, or from availability to the start of activities (see an explanation about different time perspectives here).
3. Precise timestamps
Another important point of attention is to make sure that the timestamps are as precise as possible. It is a common data quality problem that data sets only contain the date on which an activity was performed (and no time).
When the timestamps are different, this is not a problem because the process mining tool can re-establish the correct sequence (see illustration below). However, as soon as multiple activities have occurred on the same day we don’t know what the correct order is anymore (see our guideline on how to resolve this data quality issue via pre-sorting the data here).
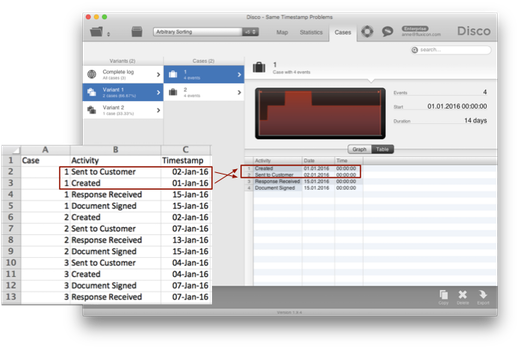
To avoid same timestamp activities altogether, you can best make sure that the timestamps are recorded with as much precision as possible.
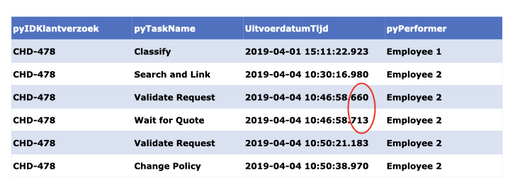
As the data snippet from Vivat below shows, for automated process steps even the precision level of seconds is not always enough (the two events highlighted with the red circle occurred in the same second). So, it is recommended to record timestamps on the millisecond (or microsecond) level if you can.
4. Correlated case IDs
It can be a big challenge to look at the end-to-end process if the process has sub IDs that are disconnected from each other. This was a problem in Vivat’s old system, where the front-office and back-office processes could not be connected at all. If you have such disconnected case IDs, you are only able to analyze the individual sub-processes in isolation. You cannot get the full picture of how they all work together.
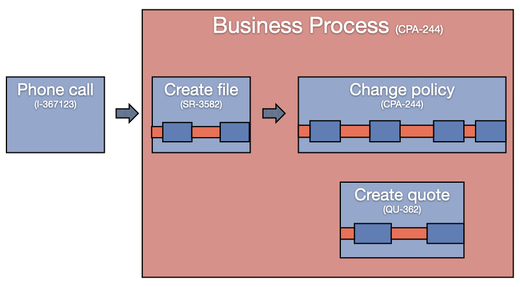
In the new system, Vivat ensured to maintain the connection between the different sub IDs that belong to the same business process and linked them all to an overall case ID (here the policy change request ID CPA-244 is used as the common case ID).
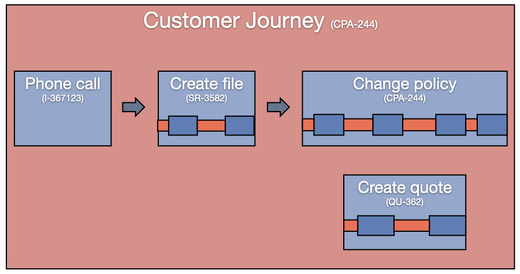
Then, they took the next step and also included the call center records as well. As a result, they can analyze the full end-to-end customer journey for their insurance handling processes.
5. Easily adding extra attributes
Now, having very detailed and fully connected data at their disposal, Gijs and Erik want to analyze the process to find opportunities for improvement. For example, they want to analyze how customer satisfaction results relate to the process. And they want to evaluate whether a new piece of functionality has had the intended effect. To actually perform such analyses, they need to be able to include the relevant information about the drivers of improvement in the data.
At some point, a new web form was introduced on the website. Because the new form automatically already includes some data for the customers, the process should be faster and easier for them. To analyze whether the process went indeed better for those customers who were using the web form, Erik and Gijs needed to enrich their current data with a new attribute that tells them whether the request was submitted via the web form or not. Fortunately, their new set-up allows them to continuously add new data attributes very easily.
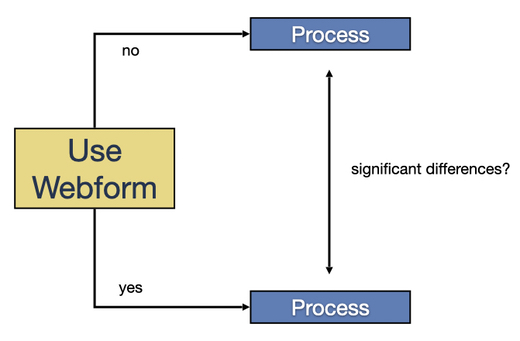
If you are in the situation of designing the data for a new system yourself, make sure to include extensibility as a requirement as well. You can never know all the attributes that you will need for future analyses in advance. Or the information may not even be available yet. For example, the web form from the example above was only introduced after the new system was already in place.
6. Easy data access for analysis
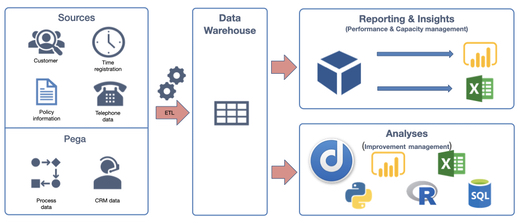
Finally, in addition to ensuring complete, detailed, correct, and extensible data, you also want to make sure that the data is easily accessible for the data analysts.
In Vivat’s case, the data is automatically processed and made available for reporting tools and for analyses purposes via a data warehouse. So, Gijs and Erik can get fresh data themselves any time they want to run a new analysis—without needing to ask the IT department to extract the data for them. This fast data access now provides the basis for their fast and iterative continuous improvement cycles.
A big thanks again to Erik and Gijs and to all of you for tuning in!
Are there any points that you would add to this checklist? Let us know via cafe@fluxicon.com. We are really curious to hear your additions.
Leave a Comment
You must be logged in to post a comment.