

Data Analytics Tutorial for Beginners
Data Analytics Tutorial Overview
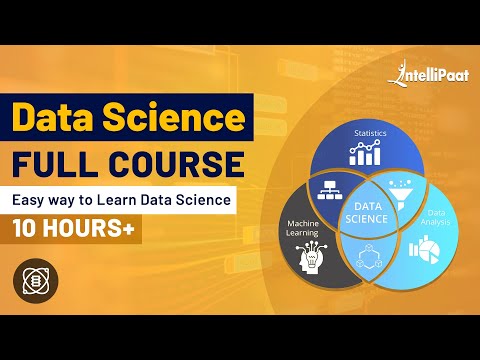
In general, when data is processed quantitatively and qualitatively to generate some useful insights from it, the process is known as Data Analytics. There are many steps included from extracting data to categorizing it to finding some patterns, connections, and other information that may be an asset to the organization.
The topics which we are going to cover today are:
- What is Data Analytics?
- Importance of Data Analytics
- Difference between Data Science and Data Analytics
- Data Analytics Tools
- Types of Data Analytics
- Data Analytics Lifecycle
- How to become Data Analyst
- Career Scope
- Conclusion
Watch this Data Analytics for Beginners tutorial:
What is Data Analytics?
The science of studying raw data to draw conclusions about it is known as data analytics. Data analytics can assist a business in optimizing its performance, performing more efficiently, maximizing profit, and making more strategic decisions.
For the most extensive data manipulation, data analytics relies on several software tools, including spreadsheets, data visualization, and reporting tools, data mining applications, or open-source languages.
Importance of Data Analytics
Data analytics is a crucial component of giving firms a competitive edge. Here are a few ways that will explain why data analytics are critical for businesses today:
- Product Development: Data analytics enables prediction as well as knowledge discovery. It gives a strong foundation for predicting future results and aids in understanding the current status of the business or process. With the help of data analytics, businesses can better understand the state of the market, adjust their processes, or determine why they need to produce new products to satisfy market demands.
- Targeted Content: Having advanced insights into what clients want makes marketing campaigns more personalized. It allows businesses to tailor their marketing to a specific portion of the customer base. They can later use it to evaluate which consumer group will respond to that marketing product. Additionally, it lowers the cost of influencing a customer to make a purchase and increases the general effectiveness of marketing campaigns.
- The efficiency of operations: Data analytics can assist businesses in finding more opportunities to optimize their operations or increase their earnings. It provides a sense of relief to a company by identifying potential issues before they occur so that proper action can be determined accordingly. Additionally, companies can assess the operations that produced the best results and also the operations that might have an error, and the one that needs improvement.

Difference between Data Science and Data Analytics
Although the terms are frequently used together, data science and data analytics are separate fields, with the range of scope being the primary difference. Data science is an umbrella phrase for a variety of fields that are used to mine massive datasets. On the other hand, Data analytics provides a much more specialized form of this, which can even be regarded as a component of a larger procedure. Analytics is dedicated to generating effective results that may be implemented right away based on existing queries.
Exploration is another major difference between the two. The goal of data science is to seek out information by filtering through enormous databases, sometimes in an unstructured manner. It is not concerned with providing answers to specific questions. Data analysis works best when it is focused, on questions that need to be answered using existing data. Data analytics prioritizes finding answers to questions that have already been posed, whereas data science generates larger insights that focus on questions that should be answered.
Data Scientists must be fluent in mathematics and statistics, as well as have experience in programming (Python, R, SQL), predictive modeling, and machine learning. Data analysts must be proficient in data mining, data modeling, data analysis, and database management and visualization. Data Scientists and analysts must be strong problem solvers & critical thinkers.
Data Analytics tools
Now let’s discuss some tools which are widely used in Data Analytics:
- Python: Python being a versatile programming language comes with many benefits that are frequently used to streamline enormous and complex data collections. It is an ideal choice for analysis because it offers a variety of distinctive features such as,
- Easy to learn
- Flexibility
- Lots of libraries
- Built-in analytic tools
- Hadoop: Hadoop is a game changer in big data and analytics. Data collected about people, processes, items, technologies, and so on is only relevant when meaningful patterns emerge, resulting in better decisions. Hadoop assists in overcoming the difficulty of large data’s vastness by providing some amazing features like:
- Resilience
- Low cost
- Scalability
- Data diversity
- Speed
- SQL: Operations like creating, modifying, updating, and deleting records in a database are performed using SQL(Structured Query Language). Perhaps the most common application of SQL today (in all of its forms) is as a foundation for creating simple dashboards and reporting tools, sometimes known as SQL for data analytics. SQL creates user-friendly dashboards that may present data in several ways because it makes it so simple to send complex commands to databases and change data in a matter of seconds.
- Tableau: Tableau is a comprehensive data analytics tool that enables you to prepare, analyze, collaborate, and share big data insights. Tableau excels at self-service visual analysis, allowing users to ask new questions of big controlled data and quickly communicate their findings throughout the organization
- Splunk: Splunk assists businesses in getting the most out of server data. This offers effective application administration, IT operations management, compliance, and security monitoring. Splunk is powered by an engine that collects, indexes, and handles large amounts of data. Every day, it can process terabytes or more of data in any format. Splunk analyzes data in real-time, building schemas as it goes, enabling enterprises to query data without first understanding the data structure. Splunk makes it easy to load data and start analyzing it straight away.
- R programming: R analytics is data analytics performed with the R programming language, which is an open-source language used mostly for statistical computing and graphics. This programming language is frequently used for statistical analysis and data mining. It can be used in analytics to find trends and create useful models. R can be used to create and develop software programs that perform statistical analysis in addition to helping firms analyze their data.
Learn Data Science from experts! Click out this Data Science course in India.
Types of Data Analytics
Data Analytics can be of 4 major types:
- Predictive analytics: Predictive analytics is a subset of advanced analytics that provides predictions about future outcomes from past data paired alongside statistical modeling, data mining techniques, and machine learning. Businesses use predictive analytics to look for trends in this data and identify challenges and opportunities.
- Descriptive analytics: Descriptive analytics is the practice of identifying trends and relationships utilizing current and historical data. It is sometimes referred to as the most basic type of data analysis as it describes trends and correlations without diving much deeper.
- Prescriptive Analytics: Prescriptive analytics is a method that analyzes data and delivers rapid advice about how to optimize business activities to meet a variety of predicted outcomes. Prescriptive Analytics predicts not just what might happen and when it will happen, but also why. Additionally, prescriptive analytics can recommend options for how to seize a future opportunity or decrease a future risk, and it can also explain the implications of each option.
- Diagnostic Analytics: Diagnostic analytics is a type of advanced analytics that evaluates data or information to answer the question, “Why did it happen?”. Companies utilize this analysis because it provides a thorough understanding of a problem, and they also maintain detailed records of their disposal, as individual data collecting for each problem would be time-consuming and inefficient.
Career Transition


Data Analytics Lifecycle
The Data Analytics Lifecycle is a cyclical process that outlines the creating, gathering, processing, implementing, and analyzing of data for various purposes in six different stages:
- Discovery – During the first phase of data analytics, stakeholders regularly execute the following tasks: assess business trends, conduct case studies of similar data analytics, and research the domain of the business industry. The entire team evaluates the internal infrastructure, internal resources, the total time required, and technical requirements. As soon as all of these analyses and evaluations are finished, the stakeholders begin developing the basic theory for solving all business difficulties in the context of the current market situation.
- Data preparation – After the data discovery phase, the data is prepared in the second step by changing it from existing systems into a data analytics form through the sandbox platform. A sandbox is a scalable platform often used by data scientists for data preprocessing. High-capacity storage, large CPUs, and large I/O capacity are all included in it. The stakeholders involved in this phase are largely involved in data preprocessing for preliminary results using a typical sandbox platform.
- Model planning – The third part of the life cycle involves model planning, in which the data analysts properly plan the methodologies to be adapted and the numerous workflows to be followed throughout the next stage of model construction. At this point, the team decides on the various divisions of work in order to precisely specify the workload amongst team members. The previously prepared data is further investigated in order to fully understand the numerous features and their correlations as well as to conduct feature selection for the model.
- Model building – The next stage of the cycle is model creation, in which the team creates datasets for training, testing, and production. Additionally, the model is put into action depending on the planning done in the earlier phase. The type of environment necessary for the model’s execution is chosen and set up in advance, allowing for the application to a more durable environment as needed.
- Communicate results – Phase five of the life cycle examines the project’s outcomes to determine whether it was successful or unsuccessful. The outcome is carefully examined by the whole team and its stakeholders in order to make conclusions about the important discoveries and compile all of the work done. The business values are also quantified, and a detailed narrative of the main findings is developed and shared with the various stakeholders.
- Operationalization – The team prepares a final report, together with briefings, source codes, and relevant papers, during phase six. The final phase also includes executing the pilot project to implement and evaluate the model in a real-time context. Data analytics delivers value to people, customers, business sectors, and other organizations by enabling the development of models that improve decision-making.
How to Become a Data Analyst?
You’ll need academic qualifications along with some specific skills to begin your career in data analysis.
Academic Qualifications
Having a decent CGPA and a graduation degree from a data analysis program is recommended. Even if a person does not specialize in data analysis, a degree in mathematics, statistics, or economics from a well-known university can lead to an entry-level Data Analyst position.
The majority of entry-level data analyst positions require at least a bachelor’s degree. Higher-level data analyst jobs often pay more and may require a master’s degree. Aside from the degree, a person interested in becoming a Data Analyst may enroll in online courses.
Skills
- Programming Skills: A Data Analyst should be aware of any one programming language. Data manipulation programming languages include R, Python, C++, Java, MATLAB, and PHP.
- Data Management and Manipulation: A Data Analyst should be familiar with programming languages such as R, HIVE, and SQL. Creating queries to retrieve the relevant data is a crucial element of Data Analytics. To provide accurate reports, a data analyst must be familiar with industry-standard technologies like SAS, Oracle Visual Analyzer, Cognos, Microsoft Power BI, Tableau, etc.
- Good Mathematical skills: A Data Analyst needs to be proficient in math and be able to work out typical business problems. They also need to be able to use tables, charts, graphs, and other visual aids. Algebra at the collegiate level must be mastered to make the visualization of data appealing.
- Excel: One of the key duties of data analysts is gathering and organizing data. Therefore, it is preferable if a data analyst is familiar with Excel.
You can start preparing right away by going through these Data Analyst Interview Questions now!
Career Scope
A data analyst may expect great compensation, engaging work, and outstanding job security. This is a career that is always changing and requires great attention to detail and a focus on quality.
Data Analyst is a position that is clearly on the rise. The difference between mid-level and senior-level positions is determined by experience and extra education. However, due to the high demand for Data Analysts at all levels, the expected job growth for each tier over the next decade ranges from 5% for Financial Analysts to 25% for Operations Research Analysts.
Courses you may like
Conclusion
One of the key elements pushing some of today’s biggest and greatest firms ahead is data analytics. In this highly competitive environment, businesses that can turn data into useful information will undoubtedly succeed. Hence, Any business that uses data analytics effectively can easily outperform its competitors.
You can enroll yourself in Data Science Training to begin your Data Science and Data Analytics career!
The post Data Analytics Tutorial for Beginners appeared first on Intellipaat Blog.
Blog: Intellipaat - Blog
Leave a Comment
You must be logged in to post a comment.