
Data Analytics Life Cycle
What is Data Analytics Life Cycle?
Data is precious in today’s digital environment. It goes through several life stages, including creation, testing, processing, consumption, and reuse. These stages are mapped out in the Data Analytics Life Cycle for professionals working on data analytics initiatives. Each stage has its significance and characteristics.
Table of contents:
Importance of Data Analytics Life Cycle
The Data Analytics Life Cycle covers the process of generating, collecting, processing, using, and analyzing data to achieve corporate objectives. It provides a systematic method for managing data to convert it into information that can be used to achieve organizational and project goals. The process gives guidance and strategies for extracting information from data and moving forward on the proper path to achieve corporate objectives.

Data professionals use the circular nature of the Life Cycle to go ahead or backward with data analytics. Based on the new information, they can decide whether to continue with their current research or abandon it and redo the entire analysis. Throughout the process, they are guided by the Data Analytics Life Cycle.
Enrich your knowledge by reading this comprehensive Data Science Tutorial!
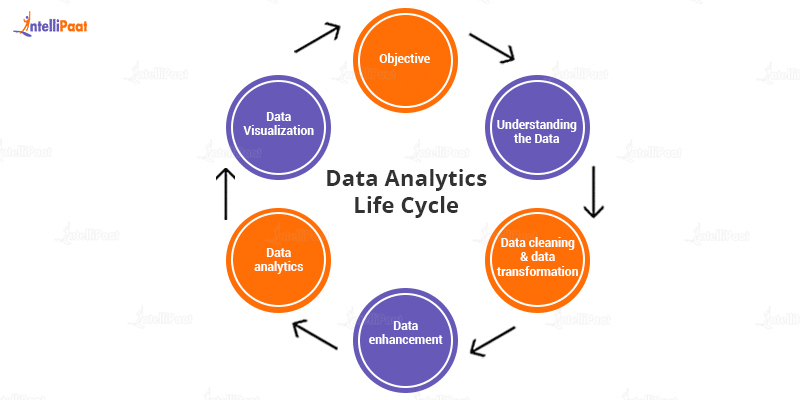
Data Analytics Life Cycle Phases
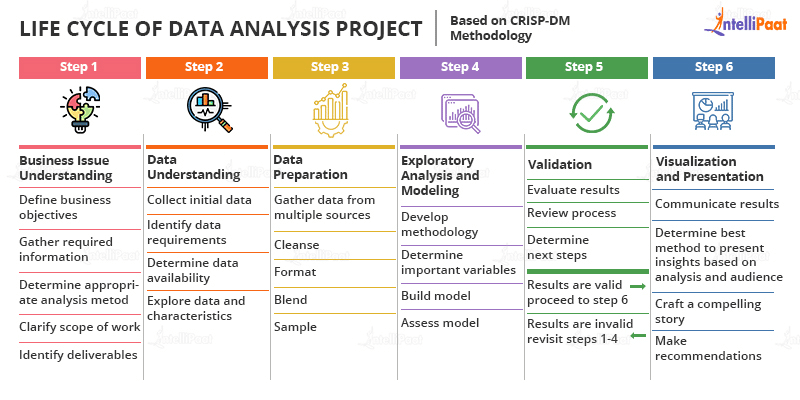
A scientific method for creating a structured framework for the data analytics life cycle is divided into six stages of data analytics architecture. The framework is straightforward and cyclical. This means that all of the processes in the data analytics life cycle in big data must be completed sequentially.
It’s also worth noting that because these phases are cyclical, they can be taken both forward and backward. So here are the six data analytics phases, which are the most fundamental processes that must be followed in data science projects.
Phase 1: Data Discovery and Formation
Everything starts with a purpose in mind. In this phase, you will identify the objective of your data and how to achieve it after the data analytics Life Cycle. The purpose of this initial phase is to conduct evaluations and assessments to develop a fundamental hypothesis for resolving any business problems and issues.
The first stage entails mapping out the potential use and demand of data, such as where the data is coming from, the story you want your data to portray, and how your business benefits from the incoming information.
As a data analyst, you will need to explore case studies using similar data analytics and, most crucially, examine current company trends. Then you must evaluate all in-house infrastructure and resources, as well as time and technological needs, in order to match the previously acquired data.
Following the completion of the evaluations, the team closes this stage with hypotheses that will be tested using data later on. This is the first and most critical step in the big data analytics Life Cycle.
Key takeaways:
- The data science team investigates and learns about the challenge.
- Create context and understanding.
- Learn about the data sources that will be required and available for the project.
- The team develops preliminary hypotheses that can later be tested with data.

Phase 2: Data Preparation and Processing
The data preparation and processing phase involves gathering, processing, and purifying the collected data. One of the most important aspects of this step is ensuring that the data you require is available for processing.
The following techniques are used to acquire data:
- Data Acquisition: Accumulate data from external sources.
- Data Entry: Within the organization, creating new data points utilizing digital technologies or manual data input procedures.
- Signal Reception: Information gathering from digital devices such as the Internet of Things and control systems.
An analytical sandbox is required during the data preparation phase of the data analytics Life Cycle. This is a scalable platform used to process data by data analysts and data scientists. The analytical sandbox contains data that has been executed, loaded, and altered.
There is no defined order in which this phase of the analytical cycle must take place; it may be repeated at a later time as necessary.
Phase 3: Design a Model
After you’ve defined your business goals and gathered a large amount of data (formatted, unformatted, or semi-formatted), it’s time to create a model that uses the data to achieve the goal. Model planning is the name given to this stage of the data analytics process.
There are numerous methods for loading data into the system and starting to analyze it:
- ETL (Extract, Transform, and Load) converts the information before loading it into a system using a set of business rules.
- ELT (Extract, Load, and Transform) loads raw data into the sandbox before transforming it.
- ETLT (Extract, Transform, Load, Transform) is a combination of two layers of transformation.
This step also involves teamwork to identify the approaches, techniques, and workflow to be used in the succeeding phase to develop the model. The process of developing a model begins with finding the relationship between data points in order to choose the essential variables and, subsequently, create a suitable model.
Grab high-paying analytics jobs with the help of these Top Data Science Interview Questions!
Phase 4: Model Building
This stage of the data analytics Life Cycle involves creating data sets for testing, training, and production. The data analytics professionals develop and operate the model they designed in the previous stage with proper effort.
They use tools and methods like decision trees, regression techniques (such as logistic regression), and neural networks to create and run the model. The experts also run the model through a trial run to see if it matches the datasets.
It assists them in determining whether the tools they now have will be enough to execute the model or if a more robust system is required for it to function successfully.
Key Takeaways:
- The team creates datasets for use in testing, training, and production.
- The team also examines if its present tools will serve for running the models or if a more robust environment is required for model execution.
- Rand PL/R, Octave, and WEKA are examples of free or open-source tools.
Career Transition


Phase 5: Result Communication and Publication
Recall the objective you set for your company in phase 1. Now is the time to see if the tests you ran in the previous phase-matched those criteria.
The communication process begins with cooperation with key stakeholders to decide whether the project’s outcomes are successful or not.
The project team is responsible for identifying the major conclusions of the analysis, calculating the business value associated with the outcome, and creating a narrative to summarize and communicate the results to stakeholders.
Phase 6: Measuring Effectiveness
As your data analytics Life Cycle comes to an end, the final stage is to offer stakeholders a complete report that includes important results, coding, briefings, and technical papers/documents.
Furthermore, to assess the effectiveness of the study, the data is transported from the sandbox to a live environment and observed to see if the results match the desired business aim.
If the findings meet the objectives, the reports and outcomes are finalized. However, if the conclusion differs from the purpose stated in phase 1. Then You can go back in the data analytics Life Cycle to any of the previous phases to adjust your input and get a different result.
Courses you may like
Conclusion
The circular process of the Data Analytics Life Cycle is comprised of six key steps that govern how information is created, collected, processed, used, and evaluated. Setting company goals and working toward them will guide you through the remaining stages.
Come to Intellipaat’s Community if you have more queries on Data Science, Big Data, and Data Analytics!
The post Data Analytics Life Cycle appeared first on Intellipaat Blog.
Blog: Intellipaat - Blog
Leave a Comment
You must be logged in to post a comment.