
Creating Prometheus Dashboards using Dashbuilder
Blog: Drools & jBPM Blog
Dashbuilder is a client tool for building dashboards and can consume data from any JSON source including Prometheus! It runs without a server requirement and the dashboard definition uses YML. You can run YML in an online editor or create a static website as described in the documentation.
In this article we will describe how to create Dashbuilder dashboards for Prometheus and share some samples so you can get started creating your own dashboards.
Prometheus HTTP API and PromQL
Prometheus can be accessed using HTTP to execute PromQL queries and have results in JSON format. The result of HTTP calls can have different types: Instant vector, Range vector and Scalar. According to the result type then we need to transform to the format supported by Dashbuilder.
Dashbuilder can consume any JSON array as a dataset or a more complex object to include metadata. To transform results we need to use a JSONAta expression, which may seem complex at a first glance, but once it is built we do not have to modify it anymore. Here’s the simplest dashboard that uses an expression that can be reused for any Prometheus dashboard:
properties:
    prometheusUrl: http://localhost:9090
    query: 1
    parse: >-
        >-
                $.data.(
                    {
                        "columns": result[0].(
                            [
                                {"id" : "timestamp", "type": "number"},
                                {"id" : "value", "type": "number"},
                                $keys(metric).({"id" : $, "type": "label"})
                            ];
                        ),
                        "values": (
                            resultType = "scalar" ? [result[0] * 1000, result[1]] :
                            resultType = "matrix" ? result.( $metric := metric.*; values.[ $[0] * 1000, $[1], $metric ] ) :
                            resultType = "vector" ?  result.[ value[0] * 1000, value[1],  metric.* ]
                        )
                    }
                )
datasets:
    - uuid: prometheus
      expression: ${parse}
      url: ${prometheusUrl}/api/v1/query?query=${query}
pages:
    - components:
          - settings:
                lookup:
                    uuid: prometheus
This specific expression can be modified if needed. Since it is set as an expression then you can reuse it for all datasets you are creating.
Visual Components
To show data we have multiple components that can be declared using YML.
A common component to be used with Prometheus is timeseries. This component only requires 3 columns from the dataset:
- series: a column with values that will be used as the series;
- timestamp: the timestamp column in javascript supported formats (the expression used above handle this)
- value: The value used in axis Y
Here’s a timeseries for the query prometheus_http_requests_total[1h:10s] filtering only successful HTTP requests:
- settings:
    component: timeseries
    refresh:
        interval: "2"
    timeseries:
        title:
            text: Successful Responses to Prometheus
    external:
        width: 100%
        height: 400px
    lookup:
        uuid: prometheus
        filter:
            - column: code
                function: EQUALS_TO
                args:
                    - 200
        group:
            - functions:
                    - source: handler
                    - source: timestamp
                    - source: value
We can show total values using metric components that allow us to show a specific value which can be the result of an aggregation operation, such as sum or average. Here’s for example 3 cards in a row summarizing http requests received by prometheus:
columns:
    - span: "4"
      components:
          - settings:
                type: METRIC
                general:
                    title: "All"
                    visible: "true"
                chart:
                    height: "90"
                columns:
                    - id: value
                      pattern: "#,000"
                lookup:
                    uuid: http_requests
                    group:
                        - functions:
                              - source: value
                                function: SUM
    - span: "4"
      components:
          - settings:
                type: METRIC
                general:
                    title: "Success"
                    visible: "true"
                chart:
                    height: "90"
                columns:
                    - id: value
                      pattern: "#,000"
                lookup:
                    uuid: http_requests
                    filter:
                        - column: code
                          function: EQUALS_TO
                          args:
                              - 200
                    group:
                        - functions:
                              - source: value
                                function: SUM
    - span: "4"
      components:
          - settings:
                type: METRIC
                general:
                    title: "Others"
                    visible: "true"
                chart:
                    height: "90"
                columns:
                    - id: value
                      pattern: "#,000"
                lookup:
                    uuid: http_requests
                    filter:
                        - column: code
                          function: NOT_EQUALS_TO
                          args:
                              - 200
                    group:
                        - functions:
                              - source: value
                                function: SUM

Finally we can add a filter component to allow us to read metrics about a specific handler:
- components:
      - html: <h1> Prometheus HTTP Requests</h1> <hr/>
      - html: "Filter"
        properties:
            font-weight: bolder
      - properties:
            width: "150px"
            margin-bottom: 30px
        settings:
            type: SELECTOR
            refresh:
                interval: "${refreshInterval}"
            filter:
                enabled: "true"
                notification: "true"
            lookup:
                uuid: recent_http_requests
                group:
                    - columnGroup:
                          source: handler
                      functions:
                          - source: handler
We can make the report real time by adding a refresh interval to each component and to avoid concurrent requests we can also add cache to our dataset. Adding all together we have the following report:
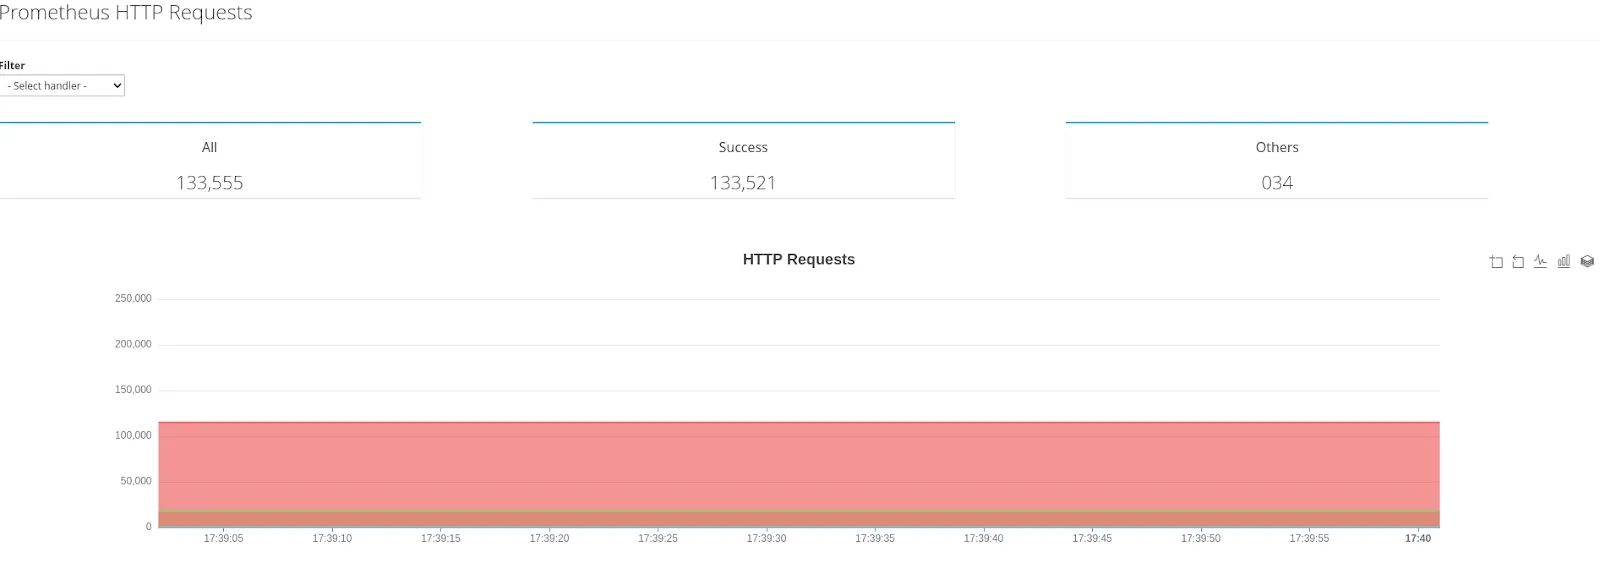
Check the code for the dashboard above in Github.
Conclusion
Dashbuilder highlights that it can run without the requirement of a server installation and has a comprehensive YML guide, which makes it a great tool for creating dashboards for Prometheus.
For more examples check the YML Samples repository!
The post Creating Prometheus Dashboards using Dashbuilder appeared first on KIE Community.