
Closing the loop with analytics: TIBCONOW 2016 day 2 keynote
Blog: Column 2 - Sandy Kemsley
Yesterday at TIBCO NOW 2016, we heard about the first half of TIBCO’s theme — interconnect everything — and today, Matt Quinn introduced the second half — augment intelligence — before turning the stage over to Mark Palmer, SVP engineering for streaming analytics.

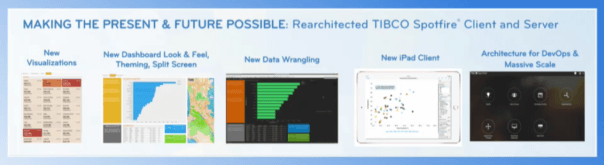
Palmer talked about the role of analytics over history, and how today’s smart visual analytics allow you to be first to insight, then first to action. We then had a quick switch to  Brad Hopper, VP strategy for analytics, for a demo of Spotfire visual analytics while wearing a long blond wig (attempting to make a point about the importance of beauty, I think). He built an analytics dashboard while he talked, showing how easy it is to create visual analytics and trigger smart actions. He went on to talk about data preparation and cleansing, which can often take as much as 50% of an analyst’s time, and demonstrated importing a CSV file and using quick visualizations to expose and correct potential problems in the underlying data. As always, the Spotfire demos are very impressive; I don’t follow Spotfire closely enough to know what’s new, but it all looks pretty slick.
 Michael O’Connell, TIBCO’s chief analytics officer, came up to demonstrate a set of analytics applications for a fictitious coffee company: sales figures and drilldowns, with what-if predictions for planning promotions; and supply chain management and smart routing of product deliveries.
Palmer came back to talk about TIBCO Jaspersoft, the other side of their analytics portfolio that provides business intelligence capabilities built in to applications, but it was a pretty quick mention with no demo. A Jaspersoft demo would look pretty mundane after seeing all of the sexy Spotfire features, but it undoubtedly is a workhorse for analytics with many customers. He moved on to ways that TIBCO is helping customers to roll analytics out, from accelerators and sample source code to engagement in the community.


He continued on with streaming analytics (Palmer was the CEO of Streambase before it was acquired TIBCO), and O’Connell came back to show an oil industry application that leverages sensor analytics to maximize equipment productivity by initiating preventative maintenance when the events emitted by the device indicate that failure may be imminent. He showed a more comprehensive interface that would be used in the head office for real-time monitoring and analysis, and a simpler tablet interface for field service personnel to receive information about wells requiring service. Palmer finished the analytics segment with a brief look at LiveView Web, a zero-code environment for building operational intelligence dashboards.

Quinn returned to talk about their B-tree-based Graph Database, which is in preview mode now with an open API, and other areas where they are looking to provide innovative solutions. He went through a history of how they’ve grown as a technology organization, and got quite verklempt when thanking his team for how awesome they’ve continued to be over the past 18 months since the acquisition, which was really touching.
 After the break, Adam Steltzner, NASA’s lead engineer on the Mars Rover and author of The Right Kind of Crazy: A True Story of Teamwork, Leadership, and High-Stakes Innovation, talked about innovation, collaboration and decision-making under pressure. Check out the replay of the keynote for his talk, a fascinating story of the team that built and landed the Mars landing vehicles, along with some practical tips for leaders to foster exploration and innovation in teams.
Murray Rode returned to close out the keynote by announcing the winners of their Trailblazer customer awards:
- Norfolk Southern (Pioneer) for implementing a real-time view of their railway operations
- CargoSmart (Innovator) for incorporating real-time optimization of shipping logistics into their cargo management software
- First Citizens Bank (Impact) for simplifying IT structure to allow for quick creation and delivery of new branch services
- University of Chicago Medicine (Visionary) for optimizing operating room turnover to save costs and improve service
- TUI Group (Transformer) for transforming their platforms through integration to enable new customer-facing tourism applications
That’s it for the morning keynote, and I’m off to catch some of the breakout sessions for most of the rest of the day before we come back for the customer panel and closing keynote at the end of the day.
Leave a Comment
You must be logged in to post a comment.