

Case study: Process Mining to Improve the Intervention Management Process at a Security Services Company

Photo Credit: 96dpi via Compfight cc
This is a guest post by Walter Vanherle from Crossroad Consulting in Belgium. Walter shares his experience from applying process mining to an operational process from a security provider.
If you have a process mining case study that you would like to share as well, please contact us at anne@fluxicon.com.
The Challenge
Security Services companies are caught between the rising costs of operations and the downward price pressure due to direct and indirect competition. Further improvements in operational excellence together with service innovation are key in addressing these challenges.
Service delivery is always managed via agreements in the form of contractual obligations based on target performance. Not reaching pre-set targets has immediate financial implications. The service provider, therefore, actively manages these agreements in order to deliver the services efficiently, with costs/penalties managed in relation to the individual client expectation and priorities between clients.
The goal of the process mining project was to measure the performance of such a security services process and to create a reference base of Key Performance Indicators (KPIs).
The Intervention Management Process
Imagine a bank who is a customer of a security services company. Someone breaks a window and the security alarm goes off at the site of the security service provider: An intervention process is started.
The intervention management process has 2 stages (see also picture below). The first stage starts with a client intervention service request (T0). Then, the dispatching unit covering the confirmation activates the service request (T1), identifies an available agent (T2), and the agent confirms the acceptance of the mission (T3).
The second stage is the intervention itself. The execution of the intervention holds 4 subsequent steps: Effective departure to the location for the intervention (T4), Arrival at the location and start of the observations (T5), End of the Observation and documenting the intervention (T6). End of Mission (T7).
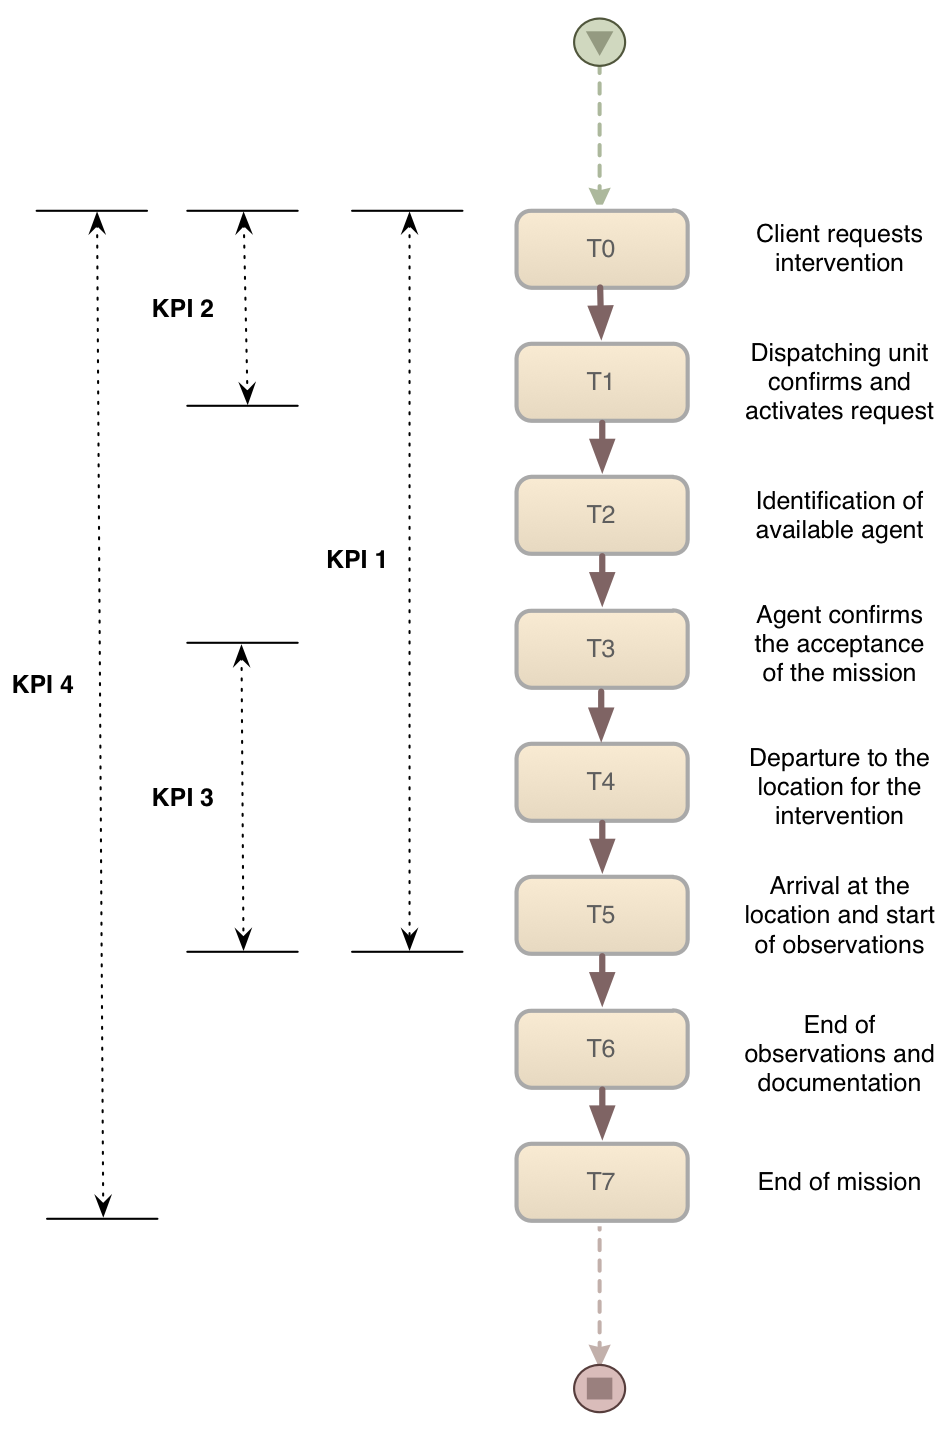
There are four KPIs that are relevant for this process. The most important one is the time from the initial client request to the arrival on site (T0-T5). Also important are the time from the client request to the confirmation (T0-T1), the time from the agent’s confirmation to the arrival on site (T3-T5), and the total time from the initial client request to the end of mission (T0-T7).
The Data
The service process execution is registered by a special service management software for security service providers by Risk Matrix Resultants. The anonymized event log held data over a period of 2 years containing all interventions for all clients. The dataset contained over 50.000 cases (missions) and 400.000 events.
The analysis below is based on the data from the missions for one client of the security service company over the timeframe of one year.
Process Mining Results
The expectation was that about 70% of the cases should follow the Straight Through Process (STP) flow with the 7 steps T0-T7 as explained above. Furthermore, the following four additional process variants were expected for the remaining 30% of the cases:
-
T0-T1 (request is not confirmed)
-
T0-T3 (solved, no intervention is needed)
-
T0-T4 (aborted in the recording)
-
T0-T7 but without T5 (no intervention is needed by accountable)
But how does the process look like in reality? Using the process mining software Disco, the real process flows could be discovered based on the data.
The process map below has been filtered to show the discovered process only for the five expected variants in the process. What stands out is that the four additional variants are almost never taken compared to the standard, STP variant, which is followed by 1518 cases. The other four expected variants are only taken by 31, 13, 2, and 20 cases, respectively.
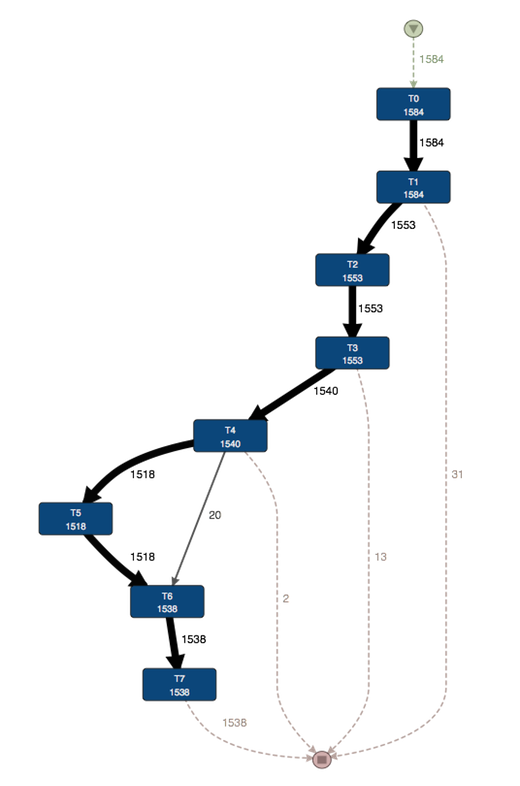
The problem is that – unlike assumed – the process does not follow just these five expected paths. The STP variants covers 78% of the cases (this is actually slightly more than expected) but the five expected variants together only make up about 82% in total. So, the question is what is happening in the other 18% of the cases?
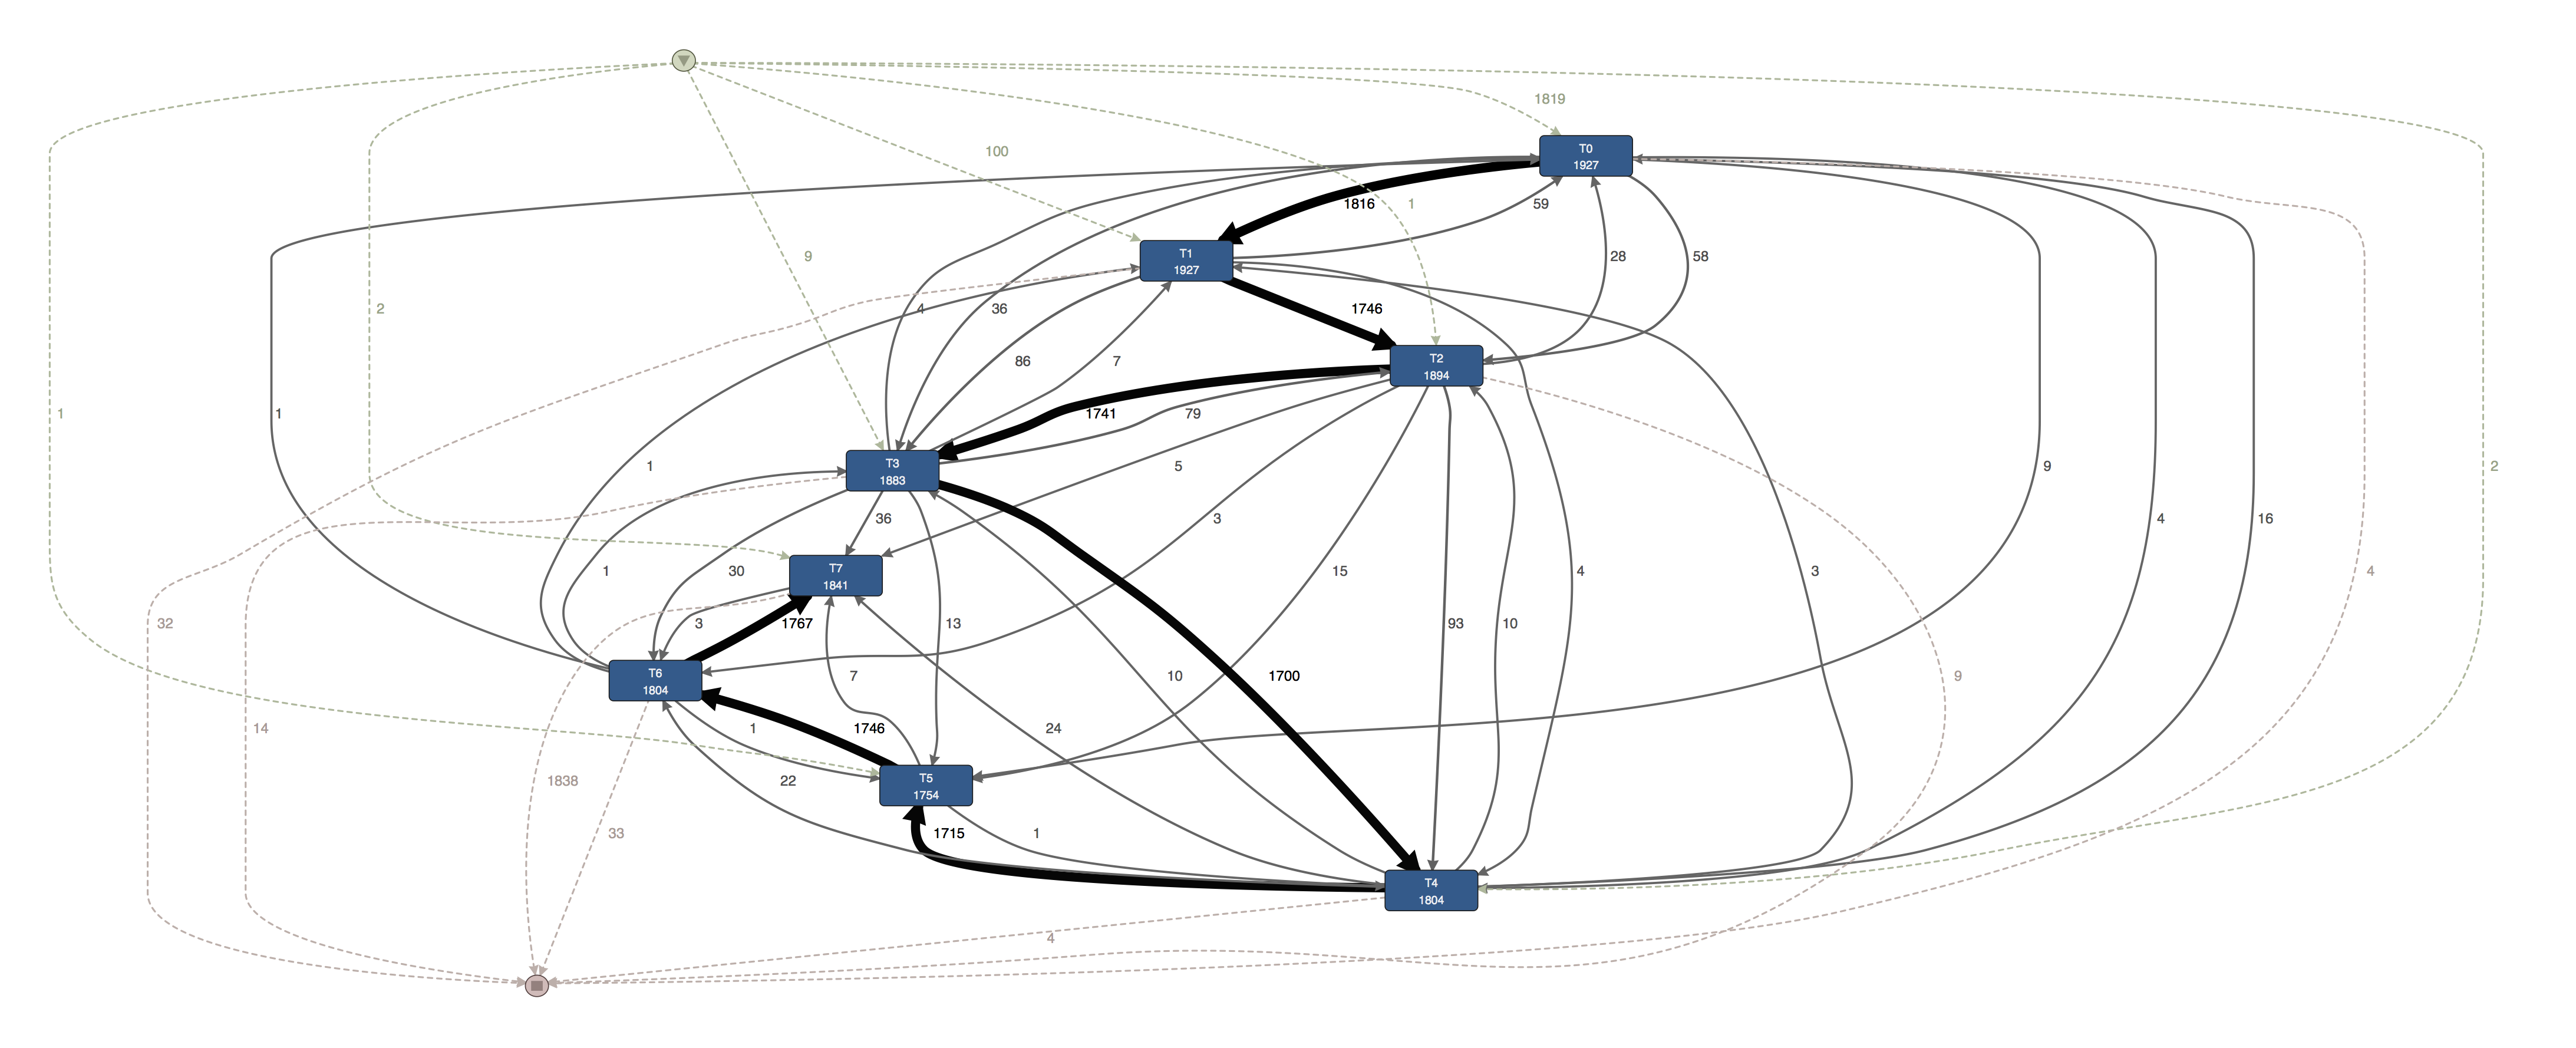
If we look at the full process, which has 58 variants (more than ten times as much as expected), then we get the following process map. The STP path is still visible, but there is a lot more variation. So, the question is what are these other variants and why are they there?
If we look at the unexpected variants, then it turns out that there are two types of root causes:
-
actual variation in the process
-
data quality problems that affect timestamps
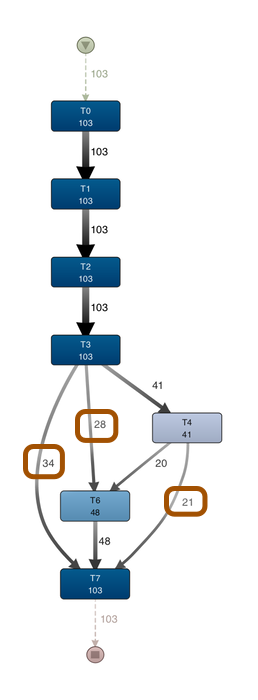
For example, if we look at the expected variant “T0-T7 but without T5”, then we see that in addition to the sequence T0,T1,T2,T3,T4,T6,T7 (wich occurred 20 times), there are some additional patterns in the process (see process map below):
-
28 times the process went from T3 straight to T6 without T4 (no departure)
-
21 times the process went from T4 directly to T7 without T6 (no arrival)
-
34 times T3 was directly followed by T7 (no observations at all)
At the same time, there were many variations that were caused by what is called “clock drift”. In this process, many different parties were recording events on different devices (which had different clocks). As a consequence, there were often confused orderings in the process step sequence that were purely caused by such a clock difference (that is, the steps were actually be performed in the right order, but due to the different clocks they appeared inverted).
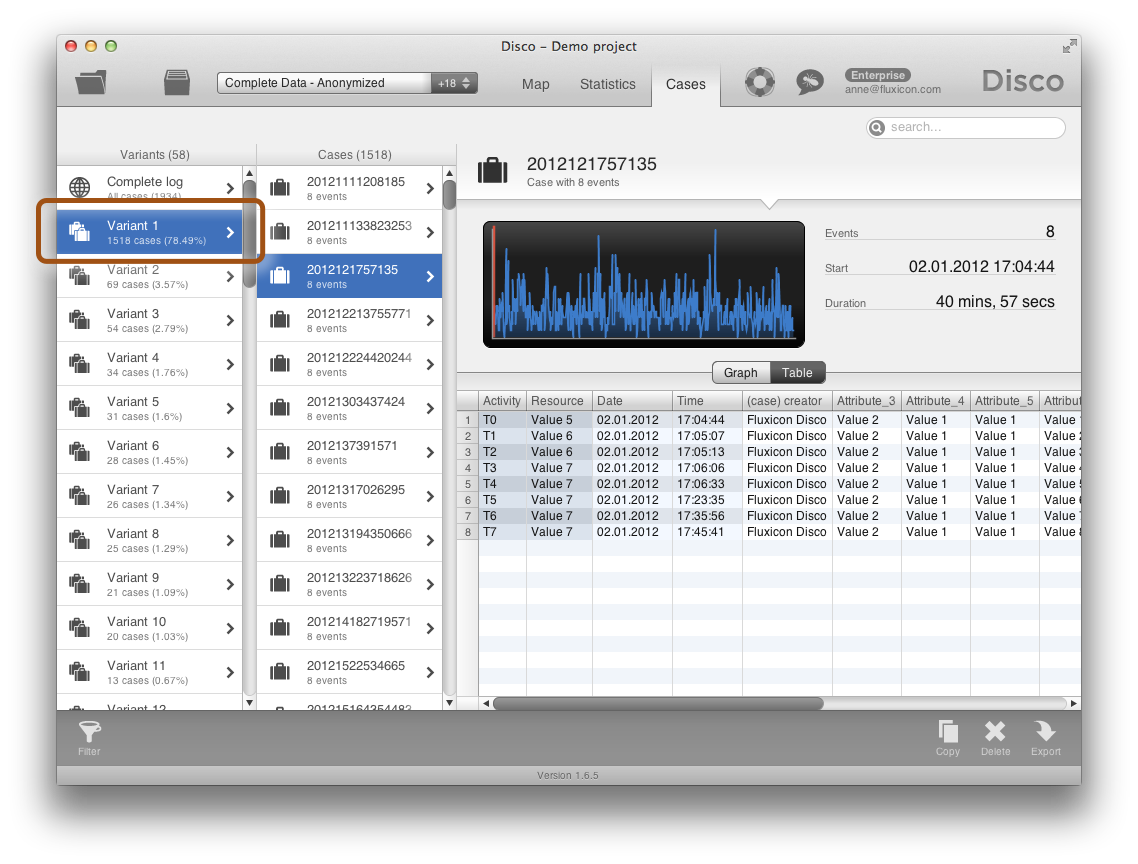
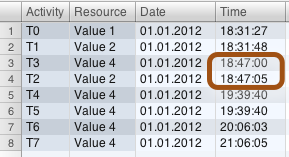
One example case, where this happens, is shown in the picture below. It seems as if T3 was performed before T2, but actually there is just a 5 sec time difference that is caused by the different clocks of the registering parties.
Such data quality problems do not only make the process variant analysis difficult, but also pose the risk to distort your KPI measuring. For example one of the KPIs was defined as the time from T0-T1. What happens now if T1 has an earlier timestamp than T0 due to the clock drift? If you just measure the time between them in Excel, you would get a negative duration that would reduce the average duration between these steps, which of course is not true.
In the intervention management Process, clock drift can occur for the transactions generated by the hand-held devices (PDAs) used by the field service agents or between the alarm generating system (T0) and the dispatching /intervention management system (T1). When the system clocks of devices are not synchronized, the recorded time stamps can shift with seconds, even minutes influencing the effective SLA timings. Using the case monitoring capacity of Disco with process filtering and visualization techniques we were able to visualize outliers quickly and suggest corrections to the transaction file compensating the irregular observations. We suppressed or eliminated the most prominent outliers from the final process mining file for more accurate performance statistics.
After cleaning the data, the SLA analysis for the KPIs (see above) was performed. We exported the durations from Disco and used a template-based Tableau Software Visualization to produce a cumulative SLA spectrum analysis. You can see such an SLA spectrum analysis for the time from T0-T5 for the year 2012 below.
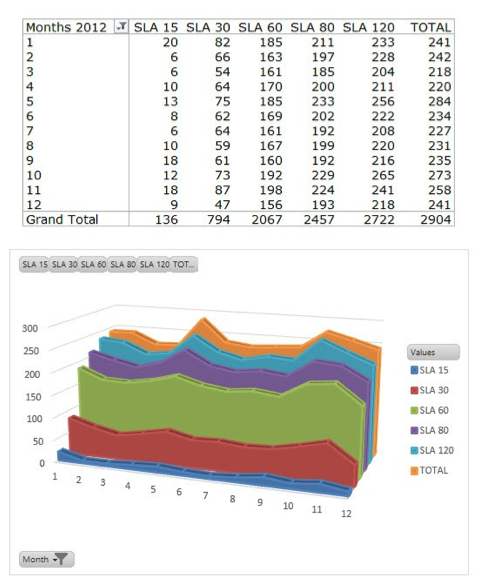 SLA spectrum analysis for a partial data set
The KPIs T0-T5 and T0-T1 are particularly important, because they are linked with financial compensation. For cost optimization and predictive analytics the process sequences T3-T5, T0-T7 were analyzed. We also filtered out groups of clients with similar or different execution patterns based on their type of service contract.
Furthermore, the following process analyses were performed:
-
priority accounts treatment,
-
work handover patterns (preferential treatment of agents),
-
correct treatment of the intervention priority classes.
Benefits and Lessons Learned
The registration process is both machine and people driven. Our experience shows that service tracking is subject to involuntary and voluntary errors and an ongoing, critical, management component. However, after overcoming these data quality challenges, we could generate many important benefits for the Security Services Company:
-
Insight in the process variants helped to focus the communication to the operations teams for more accurate recording of the activities.
-
Both conformance and performance analysis showed immediate money on the table (value leakage).
-
The provided insight is instrumental input for business strategy and tactics corrections such as adaptations in client segmentation (priority services) and the possibility for more granular time based SLA service pricing.
-
More accurate information for better planning. Recommendation for geolocation based research. Process Steps T3-T5 is the critical path in reaching target SLAs.
-
More and better information in preparation and planning for client acquisition tactics. The analysis are used in pre-sales and sales campaigns.
If you want to know more about this case study, you can get in touch directly with Walter Vanherle at walter.vanherle@crossroad.be.
Leave a Comment
You must be logged in to post a comment.