

Case Study: Process Mining to Improve a Service Refund Process

To optimize a process, you first have to understand the As-Is process. And this is usually far from simple, because business processes are performed by many different people, and often across different organizational units or even companies. Everybody only sees a part of the process. The manual discovery through classical workshops and interviews is costly and time-consuming, remains incomplete and subjective.
With Process Mining tools it is possible to leverage existing IT data from operational systems to quickly and objectively visualize the As-Is processes as they are really taking place. In workshops with process stakeholders one can then immediately focus on the root cause analysis and the value-adding process improvement activities.
Case Study Refund Process
For one of our customers, a big electronics manufacturer, we have analyzed a service refund process. The following process description has been slightly changed to protect the identify of the manufacturer. The starting point for the project was the feeling of the process manager that the process had severe problems. Customer complaints and the inspection of individual cases indicated that there were inefficiencies and too long throughput times in the process.
The project was performed in the following phases: First, the concrete questions and problems were collected, and the IT logs of all cases from the running business year were extracted from the corresponding service platform. The log data were then analyzed together with the process managers in an interactive workshop.
Process analysis
For example, in Figure 1 you see a simplified1 fragment of the beginning of the refund process. On the left side (a) is the process for all cases that were initiated via the callcenter. On the right side (b) you see the same process fragment for all cases that were initiated through the internet portal of the manufacturer. Both process visualizations were automatically constructed using Fluxicons process mining software Disco based on the IT log data that had been extracted.
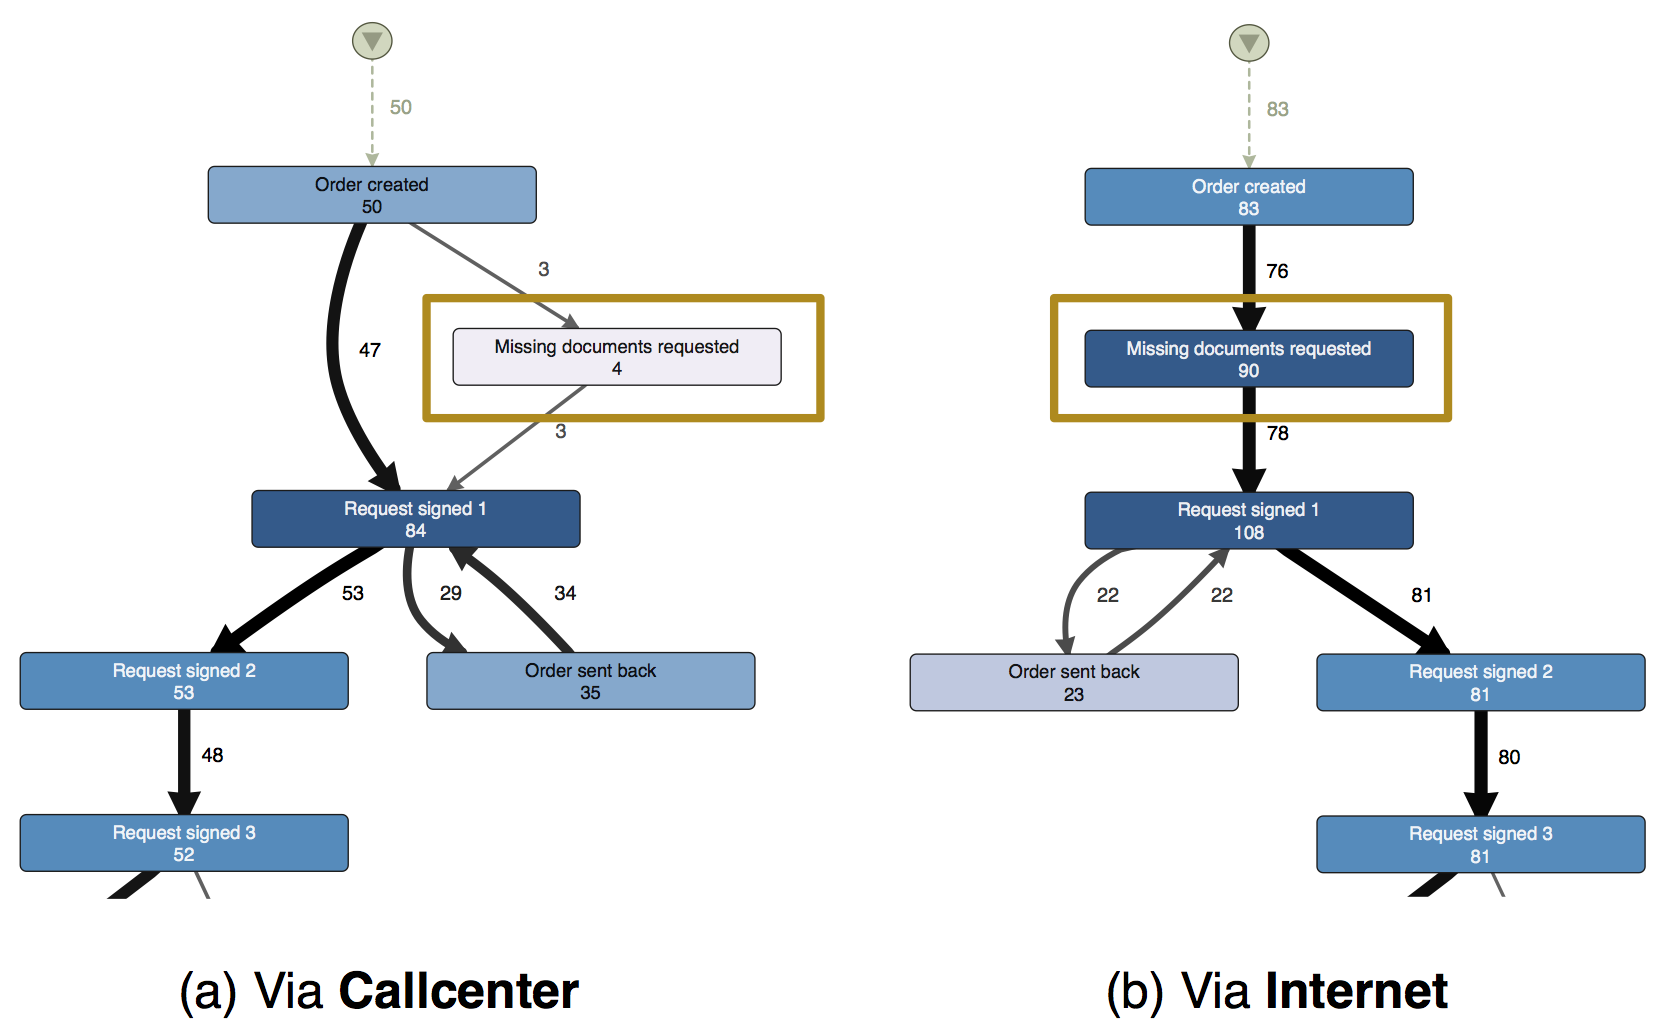
Figure 1: Process visualization of the refund process for cases that were started via the callcenter (a) and via the internet portal (b). In the case of the internet cases missing information has to be requested too often. In the callcenter-initiated process, however, the problem does not exist.
The numbers, the thickness of the arcs, and the coloring all illustrate how frequently each activity or path has been performed. For example, the visualization of the callcenter-initiated process is based on 50 cases (see left in Figure 1). All 50 cases start with activity Order created. Afterwards, the request is immediately approved in 47 cases. In 3 cases missing information has to be requested from the customer. For simplicity, only the main process flows are displayed here.
What becomes apparent in Figure 1 is that, although missing information should only occasionally be requested from the customer, this happens a lot for cases that are started via the internet portal: For 97% of all cases (77 out of 83 completed cases) this additional process step was performed. For 12 of the 83 analyzed cases (ca. 14%) this happened even multiple times (in total 90 times for 83 cases).
This process step costs a lot of time because it requires a call or an email on the side of the service provider. In addition, through the external communication that is required the process is delayed for the customer, who in a refund process has had a bad experience already. Therefore, the problem needs to be solved. By an improvement of the internet portal (with respect to the mandatory information in the form that submits the refund request) it could be prevented that information is missing when the process is started.
Performance analysis
Another analysis result was a detected bottleneck in connection with the pick-ups that were performed through the forwarding company. The process fragment in Figure 2 shows the average waiting times between the process steps based on the timestamps in the historical data. Also such waiting times analyses are automatically created by the process mining software. You can see that before and after the process step Shipment via forwarding company passes a lot of time.

Figure 2: Screenshot of the Process Mining Software Disco in the performance analysis view. It becomes apparent that the shipment through the forwarding company causes a bottleneck.
For example, it takes on average ca. 16 days between Shipment via forwarding company and Product received. As root cause for the long waiting times the company found out that products were collected in a palette and the palette was shipped only when it was full, which led to delays particularly for those products that were placed in an almost empty palette. Also the actual refund process at the electronics manufacturer takes too long (on average ca. 5 days). For the customer the process is only completed, when she has her money back.
Conformance analysis
As a last result of the process mining analysis, deviations from the required process were detected. It is possible to compare the log data (and therewith the actual process) objectively and completely against required business rules, and to isolate those cases that show deviations. Specifically, we found that:
-
In one case the customer received the refund twice,
-
In two cases the money was refunded without that the defect product had been received by the manufacturer,
-
In a few cases an important and mandatory approval step in the process had been skipped.
These business rules were informally formulated by the process managers (e.g., “The money should not be refunded before the defect product has been received.”) and could then be easily checked in an automated fashion by the filtering tools in Disco2. Some of the questions came up during the workshop and were directly verified in an interactive way.
Bottom line
In the service refund process of the electronics manufacturer, a critical bottleneck at a subcontracted forwarding company could be detected. The delayed service times were terrible for the already unhappy customers, and speeding up the service delivery was critical.
We also discovered that additional documents were requested due to incomplete information at the beginning of the process if it was started through a particular channel. The activity to request additional information was both costly to perform and delayed the overall process throughput in this client-facing RMA process. Understanding the problem could reduce this wasteful activity by more than 85% and significantly speed up the process for the customer – reducing customer complaints – as well.
What is remarkable here is that the two main problems with this process were both located in the process parts performed by external partner companies (a service company and a forwarding company). This shows how process managers can use process mining to monitor the end-to-end processes they are responsible for across companies to control the outsourced parts of the process in a better way. This is very powerful.
-
The process flow visualizations can be interactively adapted to show more or less of the details. If you are wondering why the frequency numbers in the figure don’t add up, this is because not all the process flows are shown here for simplification. ↩︎
-
You can find a complete and detailed description of all the drill-down and filtering functionality in the Disco User’s Guide. ↩︎
Leave a Comment
You must be logged in to post a comment.