Business Metrics
Blog: The Data Center
Why Business Metrics?
William Edwards Deming was a pioneer in Engineering, Statistics, and Process Optimization. He was instrumental in the spectacular rise of Japanese Industry after World War II (among many other achievements). One of the key factors in Mr. Deming’s success was his appreciation and passion for good business metrics. Deming stressed that business metrics are critical for understanding your process and ultimately improving it. At Decisions, we also believe that business metrics are a key component to business process optimization and our latest release includes many new features to help you not only capture business metrics, but to present them to your organization and drive change.
Capturing Events and Data
In 5.0, we’ve added a number of features that make capturing data easier. We have added some tools that are similar to the traffic strips that you often see on roads and at bike races. Similar to traffic strips that capture time, speed, and frequency, these new tools in Decisions can be used to track performance and trends throughout your process. For example, if your process is a rule intensive process and you’re interested in tracking and optimizing your architecture for speed, these new tools can be used to track performance. Likewise these new tools can be used for monitoring events in a workflow and capturing the data you need to identify and communicate opportunities for improvement.
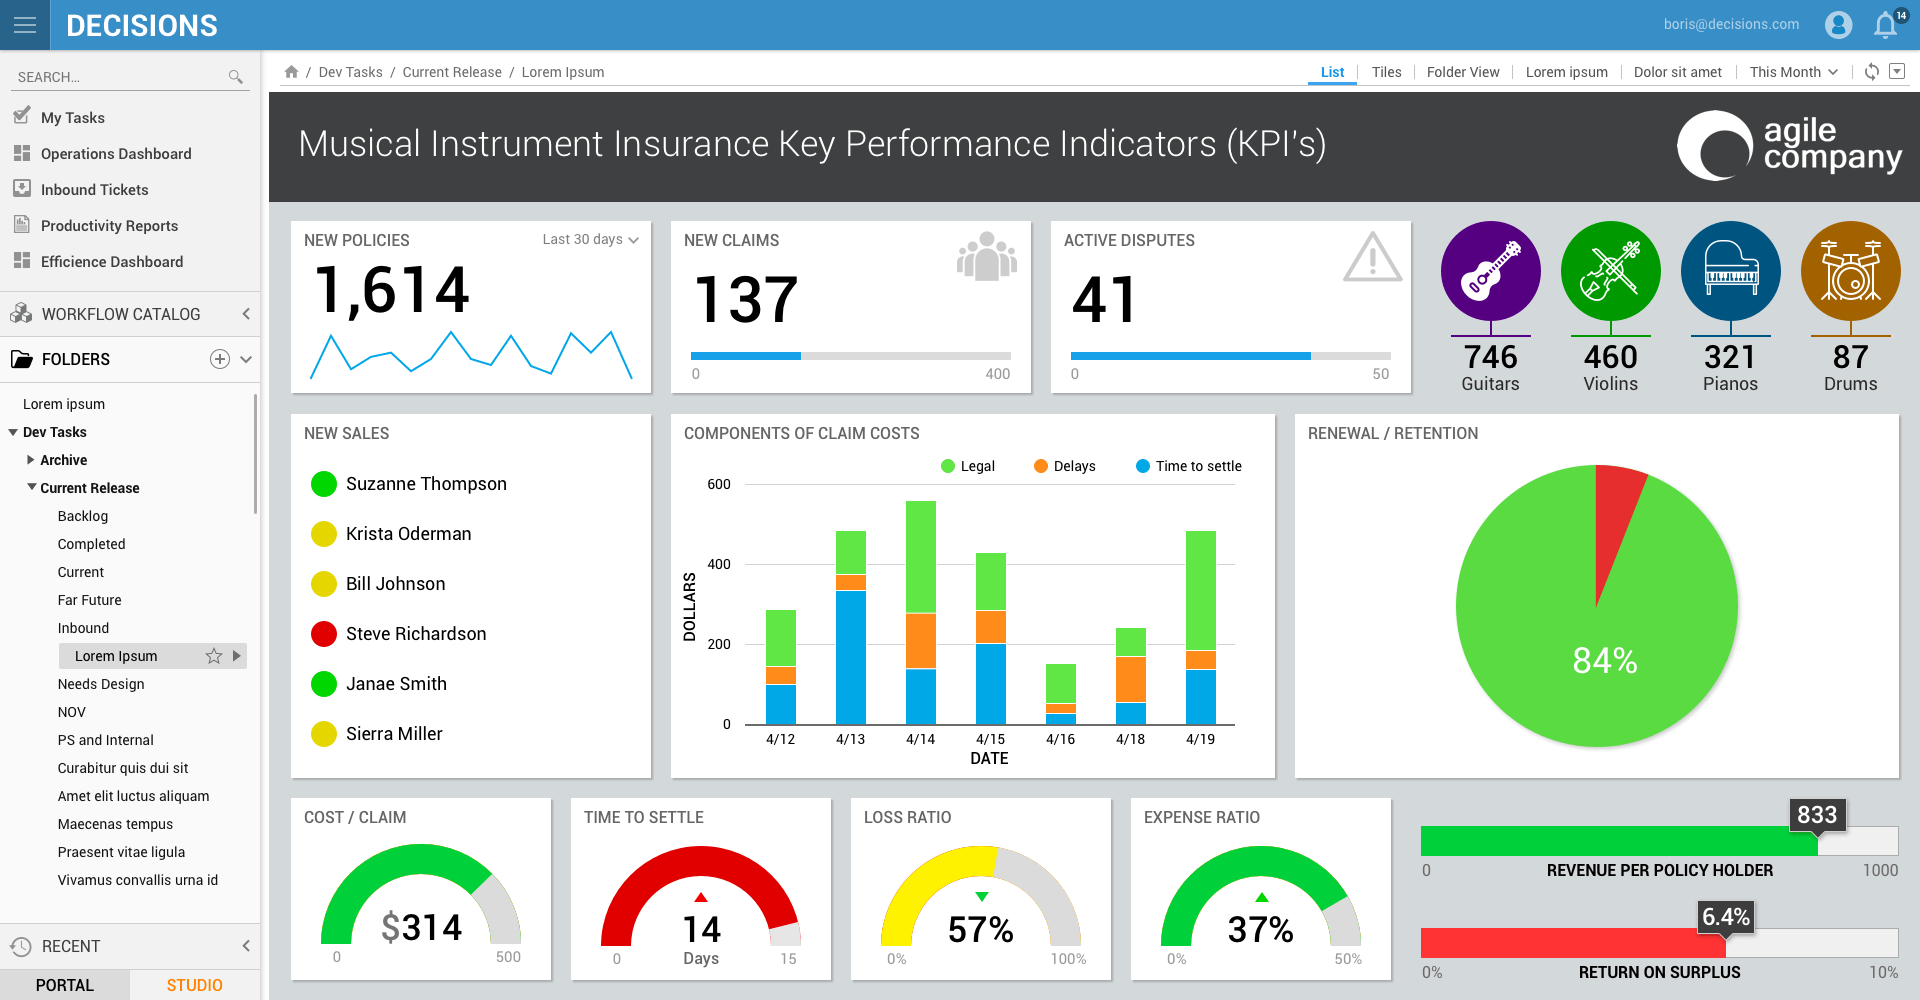
Visualizing
One of my favorite William Edwards Deming quotes is “without data, you’re just another person with an opinion”. While having data is important, I think it’s only half the battle. In order to ensure you’re not just another person with an opinion, you need a way of communicating that data to key stakeholders. The latest release of Decisions includes a number of design enhancements that allow you to create truly customized dashboards and reports. It’s now easier than ever to build visually engaging infographics that quickly let your stakeholders view and appreciate your process optimization results.
Apply Logic
After you’ve captured events and data and built a way to visualize it, the next step is to apply logic. Often, this step requires slicing and dicing data in several different ways, to understand all the possible factors driving the numbers. With Decisions you can customize reports on the fly to add or remove fields and export that information for further analysis. It’s even possible to integrate with third party analytics tools for further analysis.
The post Business Metrics appeared first on Decisions Blog.
![]()
Leave a Comment
You must be logged in to post a comment.