An Introduction to the Basics of Process Mapping
Blog: ProcessMaker Blog
Creating a process map is a powerful method for understanding and improving business processes. For those that are new to process mapping the task can seem both foreign and overwhelming.
In this process mapping guide we will cover:
- What is process mapping?
- The benefits of creating a process map
- Common types of process maps
- Process map symbols
- How to create a process map
What Is Process Mapping?
Process mapping is a management tool used to visually depict the flow of work and the steps and people involved in a business process. These maps are also commonly referred to as flowcharts or workflow diagrams. Organizations use this tool to gain a better understanding of a process and to improve its efficiency. By creating easy to follow diagrams, stakeholders can identify aspects of a process that can be improved. This includes identifying bottlenecks in workflows and other inefficiencies like repetitive tasks that are ideal for automaton.
The benefits of creating a process map
Process mapping offers many benefits. We mentioned several benefits at an abstract level – understanding a process better and improving efficiency. More specific benefits of creating a process map include:
- Boosting job satisfaction. Employees know what to expect, what their responsibilities are, and appreciate the transparency that a process map provides.
- Improve employee performance. Employees that understand their roles and where to find help when they need it are more productive.
- User friendly. Business process maps are simple to follow and are ideal for tasks like employee training and brainstorming sessions. BPM software makes it easy to design and test processes, as well as share them with the team.
- Certifications. Help organizations obtain and maintain industry certifications like ISO 9000 and 9001.
- Problem solving. A business process map allows organizations to test hypotheticals and what-ifs making it easier to identify problems and potential solutions.
Common types of process maps
There are many different types of process maps. Which one you use depends largely on the type of process that you want to map and what your business objectives are. Here are some commonly used types of process maps.
Basic flowchart
A basic flowchart is useful for creating a simple map that illustrates the inputs and outputs of a process. Some ideal use cases for basic flowcharts include planning new projects, analyzing and managing workflows, and improving collaboration among team members. Flowcharts can be created manually using the process map symbols that we mentioned above, or in a matter of minutes using business process management software.
High-level process map
A high-level process map, or top-down map, shows how a process works in a limited number of steps. They provide a quick snapshot of what a process does but do not go into detail about how a process is performed. High-level process maps are ideal for discussing processes with leadership or third parties that do not require specifics.
Detailed process map
Detail is useful for understanding the intricacies of a process. Unlike a high-level process map, detailed maps also include subprocesses; making this more useful for identifying inefficiencies and for documenting decision points within a process.
SIPOC
SIPOC is an acronym that helps stakeholders to identify the key elements of a process. The acronym stands for supplier – inputs – process – outputs – customer. SIPOC resembles a table or chart more than it does a map. Listing out the key elements, however, is an important precursor to creating a more detailed process map. SIPOC diagrams also help to define the scope of complex business processes and are useful for stakeholders when discussing a process.
Swimlane maps
Swimlane maps, or cross-functional maps, are used to show “who does what.” They separate activities into lanes or channels according to who is responsible for performing the task or process. Swimlane maps are useful for management purposes. They are ideal for training new employees and increasing accountability. Swimlane maps also help stakeholders to understand workflows and how they relate to and interact with other business processes.
Value stream maps
Value stream maps show the steps required to deliver a product or service to customers. They utilize a system of symbols to illustrate information flows and tasks. Value stream maps are particularly useful for identifying waste within and between processes. They also serve an important role in identifying opportunities and planning future projects.
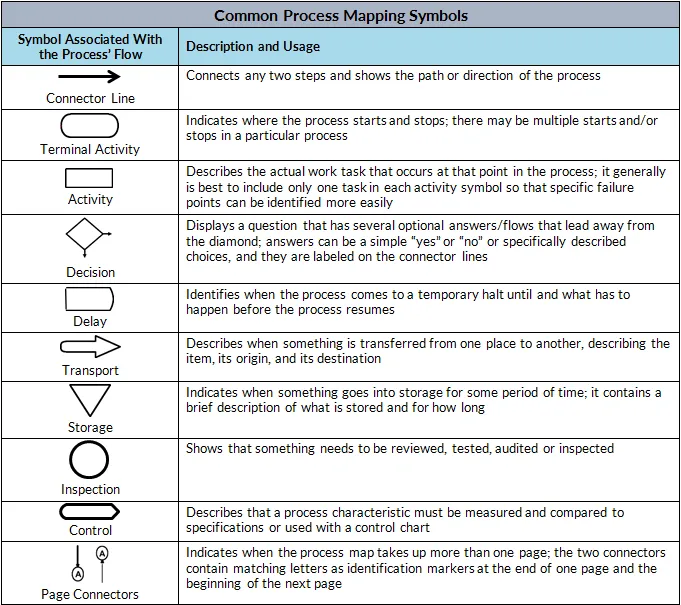
Process Map Symbols
Process maps use over 30 different symbols to depict specific elements of a process. These process symbols are also commonly referred to as flowchart symbols or flowchart shapes. The symbols come from the Unified Modeling Language (UML). UML was created by software engineers to provide a standardized way to analyze and design software programs. UML has, however, become one of the most popular systems used for business process modeling. Process map symbols fall into the following categories:
- Process/operation symbols
- Branching and control of flow symbols
- Input and output symbols
- File and information storage symbols
- Data processing symbols
For most organizations, however, utilizing a small portion of the most common symbols will be enough to complete a process map. Some commonly used process map symbols include:
Process- A rectangle is used to represent a particular process and its activities and functions.
Flowline → An arrow is used to show both the direction of flow and the connection between steps.
Terminator- A terminator shows the beginning or end of a process flow.
Decision- Indicates that a decision must be made after which the flow will follow a predefined path based on that decision.
Document(s)- A rectangle with a wavy base indicates a single document or information that can be read by people. Multiple rectangles with wavy bases indicates that there are more than one document that can be reviewed.
Delay- A delay symbol means that there is a pause in the process before the flow continues.
Manual entry- This symbol is used to show that a procedure will be performed manually by a person.
How to Create a Process Map
It is important to include all key stakeholders in the process. Everyone should understand the organization’s objectives and the basics of mapping. Manual creation involves drawing out by hand utilizing the process map symbols that we mentioned above. To simplify the process and improve collaboration, you can use business process management software. The software makes it easy to design and test processes, save your work, and share your work with team members.
When creating a process map, follow these steps:
Identify the process
The first step is to identify the process that you want to map. This could be a process that is cost prohibitive. Or one that involves manual processes and is prone to delays. Name the process and list it at the top of the document.
Assemble your team
One of the most crucial aspects of the process is to include those that are most familiar with its inner workings. The input of key stakeholders ensures that your process map is thorough and that you are not leaving out important details or considerations. Spend some time brainstorming with your team at the outset. Determine who does what, when it is done, and how it is performed.
Gather data
Following your initial brainstorming session, start gathering relevant data and information. Determine when the process begins and ends. List out all the steps required to complete the process. Identify the inputs, outputs, and the people involved.
List out the steps in sequential order
Once you have a complete list of the steps involved, work with your team to place them into sequential order. Identify the event that triggers the process and the actions and decisions that bring it to completion.
Draw the map using process symbols
Draw a process map that includes all the information that you identified in earlier steps and using the process symbols that we identified earlier in this guide. For instance, use an oval (terminator) to show the beginning of the process. The map should be an accurate depiction of the process as it currently exists.
Analyze your process map
Once your process map is completed you can use it to identify bottlenecks and inefficiencies. Look for manual tasks that can be improved through automation. Identify steps that can be eliminated. Get feedback and suggestions from each member of your team.
Improve your process
Implement the improvements that you identified in the prior step. If the improvements and suggestions will have a broad impact on the process avoid implementing them all at once. Prioritize the improvements. Start small to avoid potential disruptions to the process. Monitor the improvements, creating new process maps as you go. Determine whether further improvements are needed.
Process mapping with ProcessMaker
Creating a process map is an incredibly effective tool for improving operational efficiency and offers a broad range of organizational benefits. To get the most out of process mapping, try ProcessMaker’s industry leading low-code business process management software. Easily create detailed process maps and leverage ProcessMaker’s powerful automation solutions to transform your business processes.
The post An Introduction to the Basics of Process Mapping appeared first on ProcessMaker.