
Advocating for Automation to Your CFO (Part 3) | UiPath
Blog: UIPath.com
This article series is a deep dive into a conversation that is taking place in boardrooms around the world: how big and how fast can we go with automation? Chief financial officers (CFOs) rightly recognize that automation delivers value and most have already invested in robotic process automation (RPA) at some level. Maureen Fleming, an IDC analyst who tracks software robots has said, “I haven’t talked to anyone who’s not doing automation as a way to become competitive, and more resilient.” Gartner recently reported in a press release that spending on RPA will increase nearly 20% from 2020, reaching $1.89 billion in 2021.
And yet…
There hasn’t been universal agreement on how to communicate and measure the value of automation. This is problematic because when people are confused about how to describe value, they hesitate to ask for more funding. This article offers an automation value framework, one that will enable you to engage your CFO with confidence and conviction to gain approval for the next level of funding on your journey to becoming a fully automated enterprise™.
Begin with the end in mind: the cash flow projection
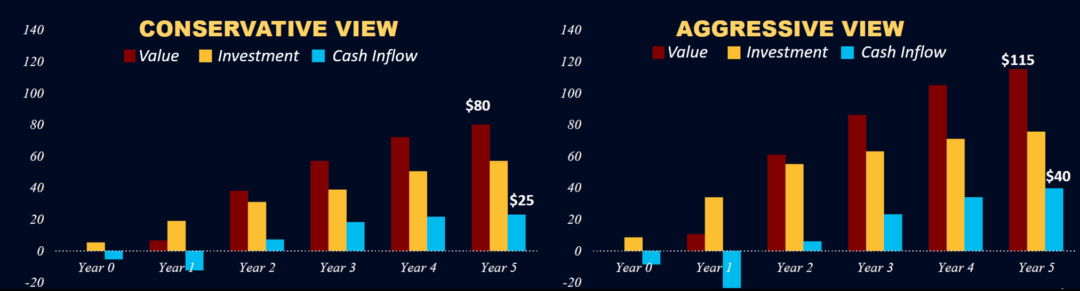
Helping your CFO make these investment decisions requires data and thoughtful analysis on investing cash now to generate more cash in the future. The example below shows a conservative versus aggressive scenario for an investment in a broad transformation program where automation plays a significant role.

First, a CFO will look at this model and see right away the financial projections are to generate cash inflows in the range of $25 million to $40 million in Year 5. To answer the question “how soon will the organization be ready to deliver on the value promised by automation?” the CFO will quickly notice that value realization starts in Year 1. The positive cash inflows begin in Year 2 in this example model.
CFOs know investments are needed to create competitive advantage. The CFO can easily find the answer to “how much will it cost to ‘stand up’ this capability” by looking at Year 0 and how much it costs to support the program over time by following the five-year investment ramp up. Naturally, you will have all the supporting details of that investment including people, software, consulting, technology infrastructure, and change management costs. Creating a predictable cost structure will be important to the CFO.
The automation value framework
Now, here is where the automation value framework comes in. The value delivered in Year 5 is $80 million to $115 million in the model. This will predictably lead to the question, “how sure are we that we can deliver the value projected?”
Many people make the mistake of presenting the CFO with funding decisions based on a total cost of operations (TCO) assessment only, or what I call “Level 1.” The CFO wants to see value delivered throughout the organization—not just IT and total cost of ownership values.
By discovering and valuing productivity benefits (Level 2) and business effectiveness impacts (Level 3) the likelihood of funding increases significantly. Ultimately, the CFO wants to show the board and the CEO that the program is delivering competitive advantage. The graphic below shows the three levels of automation value in the framework.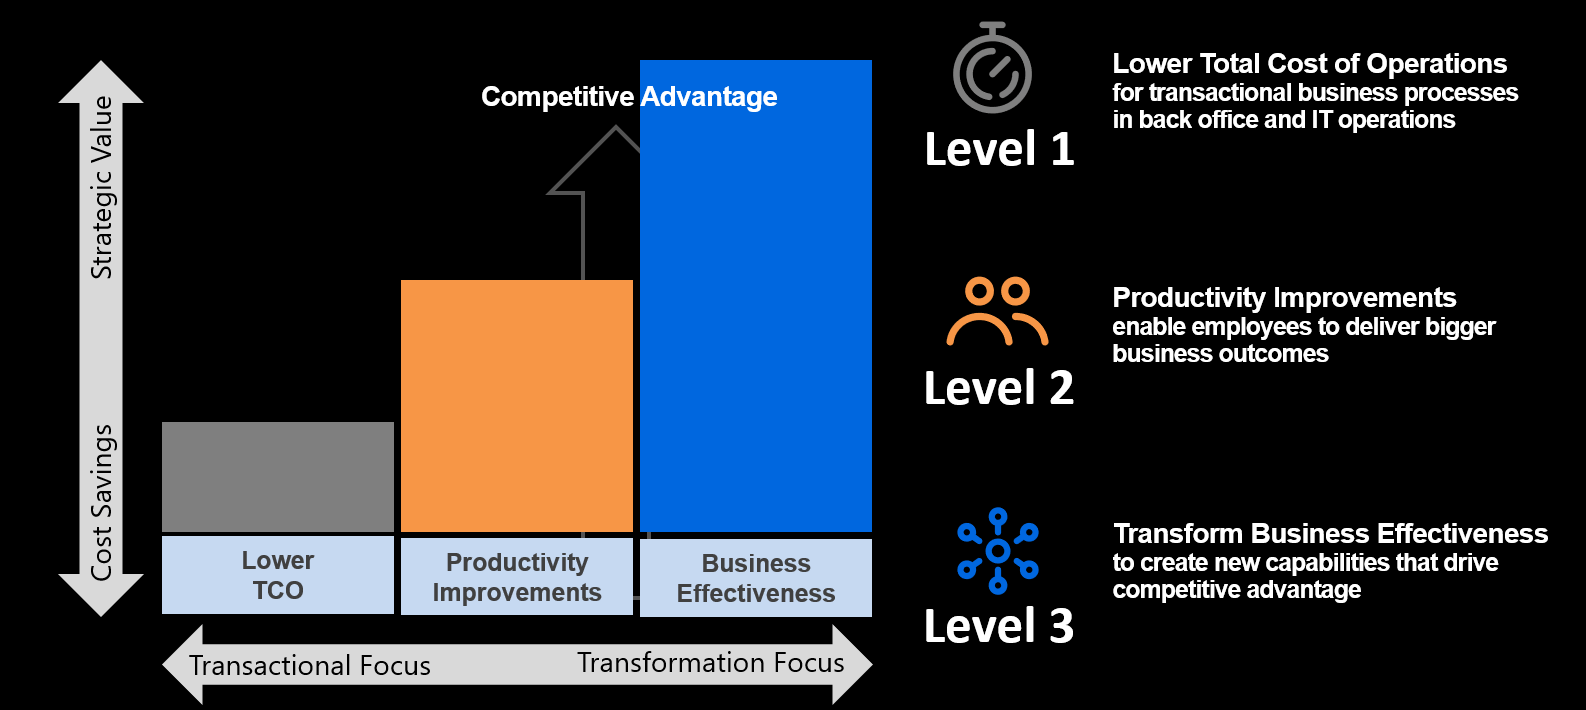
See a larger version of this automation value framework graphic (created by UiPath).
It’s not that you shouldn’t be talking about TCO—you should. You should not be talking only about TCO. Achieving a Level 1 value is done when you replace a manual step with an RPA automation—which removes cost, increases velocity, and reduces the error rate from that process step. However, a Level 3 value is achieved when the end-to-end processes are reimagined, using automation, fundamentally changing how the business outcome is achieved.
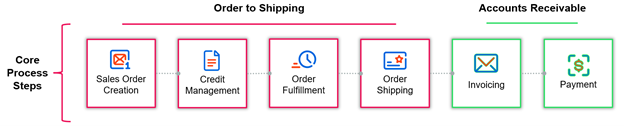
Consider a process that starts with the customer order in the front office. When there are manual steps in the high-volume order-to-shipping process, the process becomes a productivity drain and slows down the ability for accounts receivable to collect payments.
Below is a simplified view of the process steps that comprise the end-to-end order-to-cash process.
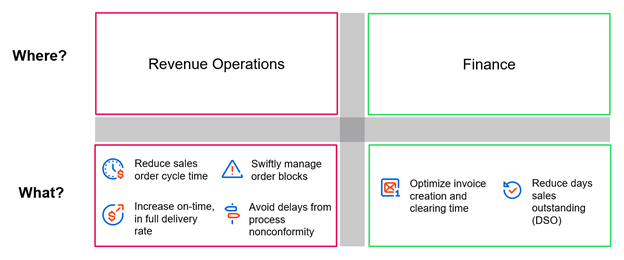
As you can see, the upstream productivity improvements in front-office revenue operations will also benefit productivity in the finance department. These Level 2 improvements from automation are focused on the metrics in the diagram below for each department.
Value beyond TCO
At the intersection of Level 2 and Level 3 automation value is a competitive advantage derived from talent optimization. One reason automation has become a C-suite priority is the tangible results it has on redesigning work and employee activities. Senior executives often cite a shortage of talent as one of the biggest threats to their business, yet they have untapped potential within the company. Many of their employee’s day-to-day work includes repetitive, low-value activities that are stifling talent.
People are force-multipliers and when they are working on what matters, they can accelerate the company’s move into new markets, introduce new products, and build a better customer experience.
Related read: Discover how robots make people happier, businesses more productive, and work better
The order to cash example above is based on a real customer. The Level 3 value that they were ultimately able to achieve was a better customer experience for their best customers. By freeing up people from transactional work in revenue operations (such as managing order blocks) they were able to transform those roles into customer-facing roles. The organization now receives higher customer satisfaction scores from their best customers because of their high-touch model.
Find out how other customers are using automation to transform their organizations.
Scenario analysis
If we go back to the example at the beginning of this article, what do you think the CFO is really thinking when they see your cash flow statement? It would be easy for us to believe that the CFO is thinking: “Okay, so if I invest about $20 million then I will get a $100 million, or so, in value in five years.” And our project would be approved.
However, don’t fall into this trap.
Instead, anticipate objections and be ready for scenario analysis.
As you are presenting your $100 million in value, my experience is that the CFO is developing a range of expected value scenarios as represented in the diagram below.
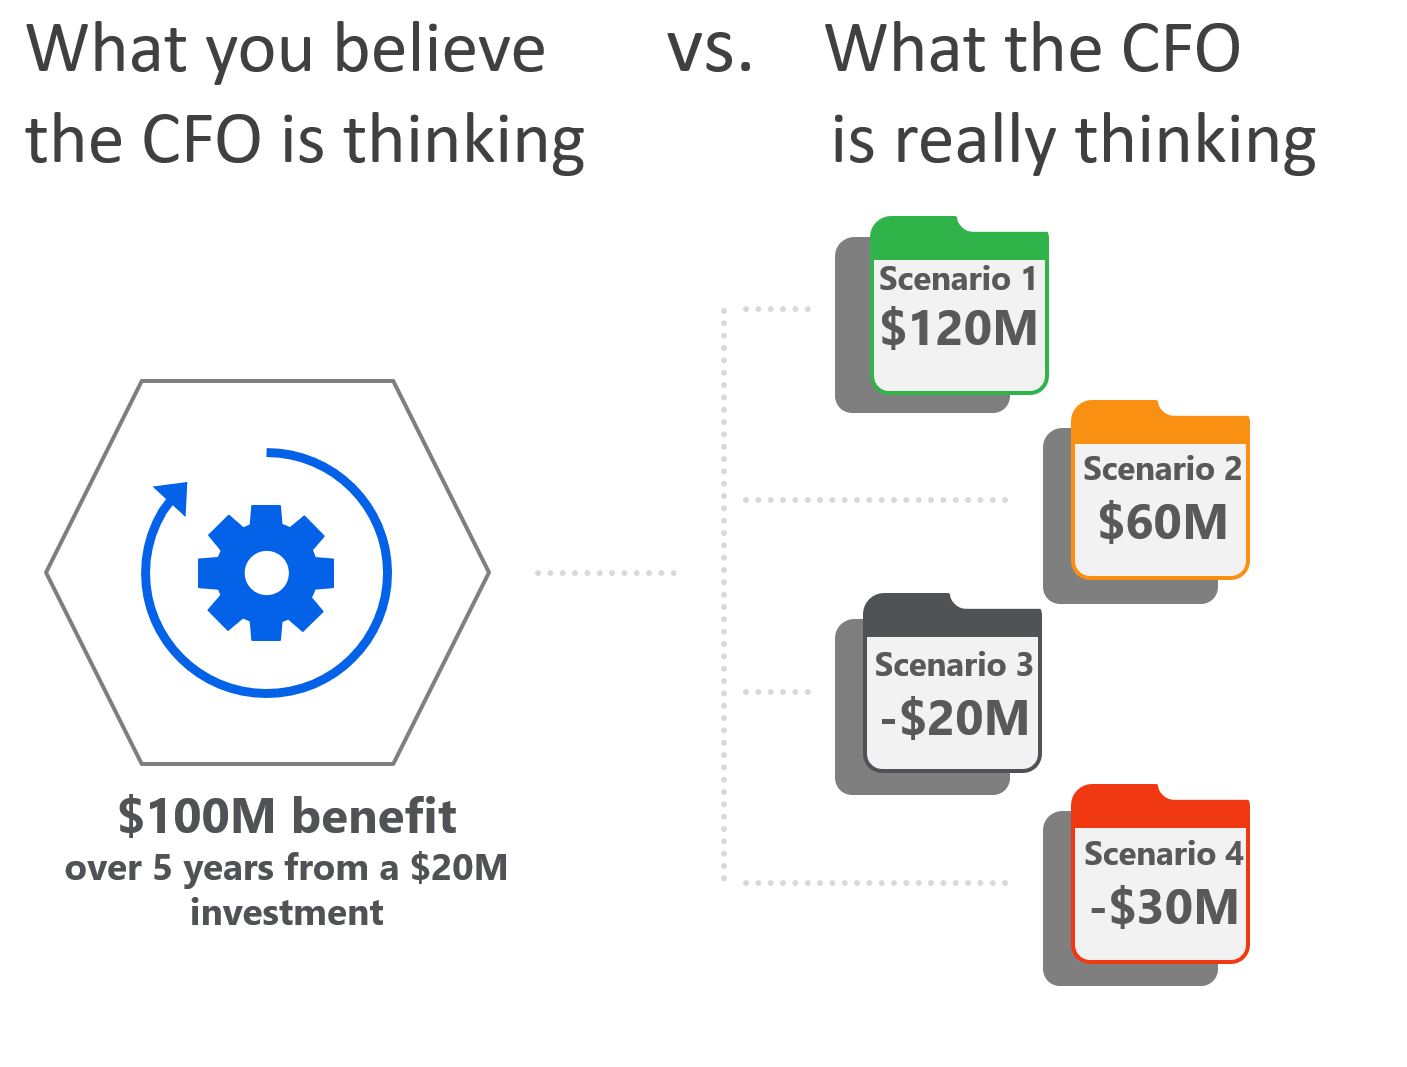
For example, the CFO may have ambitions to exceed the $100 million benefit and build a new best-case scenario of $120 million (Scenario 1). Scenario 2 is the CFO considering a 40% reduction of the value to be conservative at a $60M value projection. The bottom of the range the CFO could consider is no value and a loss of the initial investment (Scenario 3). Worse yet, if past experiences have taught the CFO to be skeptical of value projections, there may be a Scenario 4 in their mind of losing $30 million. This is a scenario where there is no value, $20 million loss of initial investment from project failure plus a $10 million negative spillover effect.
The lesson learned is that the scenarios you present (in this case conservative vs. aggressive) are just two data points and certainly do not represent all the possible outcomes. It is important to anticipate these other scenarios, from worst case to best case, and be able to address them.
The fully automated enterprise
In part one of this series, I talked about the need to create awareness of the big vision for automation with the CFO well before asking for a funding decision.
You will increase the likelihood of getting funding for automation by combining the big vision with the broader alignment covered in part two of this article series.
The automation value framework will be an important element of advocating for automation with the CFO. I would estimate that TCO, or Level 1 value, accounts for at most 40% of the full enterprise automation value.
The remaining value comes from productivity gains from turning over repetitive tasks to software robots and unleashing the full potential of people. This is where new capabilities, new capacity, and new quality initiatives come from. The Level 3 transformations are often derived from this freed up bandwidth that people have to drive innovation. Manage all three to become a fully automated enterprise.
Want to further your CFO’s interest in automation? Invite them to join our Reboot Work Festival Unplugged for Finance Leaders virtual event on February 18, 2021 at 1:00 pm ET.
The Reboot Work Festival Unplugged event is a finance-specific follow up to the popular Reboot Work Festival. If you missed any of the festival sessions, you can still access the session recordings. Use the button below to register and get complimentary access to all available recorded sessions:
![]()
Leave a Comment
You must be logged in to post a comment.


