A Comparison of the Best Data Visualization tools today!
Blog: Indium Software - Big Data
What is Data Visualization?
The presentation of data in either a graphical or pictorial format essentially defines what data visualization is.
How data visualization helps decision makers is by enabling them to view analytics presented visually.
This allows them to grasp difficult concepts easily and also in the identification of new patterns.
The interactive technologies available today further help to drill down into graphs and charts for in depth detail, in turn interactively changing the data you view and how it’s processed.
Importance of Data Visualization:
Bearing in mind as to how the human brain functions and processes information, making use of graphs and charts to visualize vast amounts of complex data is much easier than breaking our heads over spreadsheets and reports.
Data visualization is a means to convey concepts in a universal manner, only in a quicker and easier way.
Data Visualization works under many scenarios, all it requires is minor adjustments and tweaks with respect to the scenario.
Data visualization also helps with –
- Finding problem areas that require attention or improvement
- Identification of factors that include customer behavior
- Product placement in retail stores
- Sales volume prediction
So how do we do data visualization? There are many tools available today that need a Zen level of mastery to learn!
Let’s take a look at 5 tools that rule the data visualization market:
Power BI:
Microsoft created this business examination tool to empower businesses to picture and dissect information accurately and effectively.
Interfacing with various kinds of information sources is made possible with Power BI. This information will be available via altered dashboards and point by point detailing.
Power BI loaded with its own business intelligence capabilities is a very comprehensive visualization tool.
Advantages:
- Pricing – At 9.99$ a month, it is an absolute steal for BI tool
- The Microsoft Connection – Seamless integration with Excel, Azure and SQL Server
- Secure Publication of Reports
- Rich Personalized Dashboards
- Advanced Data Services are supported – Integration with Cortana etc.
Disadvantages:
- 1 GB limit per dataset
- Max workbook size is 250 MB
- Inability to work with vast amounts of data
- Bulky User Interface
Tableau
Tableau is the home of intuitive and interactive visual analytics. It is a visualization tool which can be easily used by people as well as enterprise scale organizations.
It is a tool which has an easy interface and provides killer interactive data visualization. Finding data driven solutions is why organizations love Tableau.
Advantages:
- No need for technical knowledge
- Mobile Friendly
- Ability to gather and handle large sets of data from multiple sources
- Integration with an extensive roster of native connections
- Excellent user interface
Disadvantages:
- Financial reporting cannot be done
- Poor BI Capabilities
- High Pricing
Qlikview
Qlikview is a product of Qlik which assimilates data from multiple sources and integrates it extremely quickly into a single powerful application.
This visualization tool has some brilliant and engaging state of the graphics to help you study, analyze and interpret the data.
This tool is extremely easy to use and gives you real-time answers to an inquiry you make.
All work can be done on the dashboard from anywhere you are because of the stunning mobile app.
Advantages:
- Extremely quick and easy to implement
- Fast data interpretation and analysis
- Security of data
- It has a dynamic BI ecosystem
- Real-time sharing and social analysis is possible on Qlikview
Disadvantages:
- Extra add-ons prove to be pricey
- The RAM capacity limits the rows, cells, tables and fields
- Requires handling by a trained developer
D3
If you want to produce dynamic, interactive data visualizations in web browsers, D3 is the go to tool.
The widely implemented CSS, SVG and HTML5 standards are widely made use of by D3.js. It is the successor to the Protovis framework. D3.js is a javascript library with a lot of potential in data visualization. D3 is used on majority of the websites.
Advantages:
- Integrates best on websites
- Huge library of visualizations
- No installation or maintenance costs
- Ideal for production apps
- Extremely flexible tool
Disadvantages:
- Extremely time consuming coding is required
- Does not work well for data exploration
- Work needs to start from scratch, cannot be lateral
R Shiny
Shiny is an open source tool from the R Studio. It is arguably the best visualization tool in the market as of now.
This tool specializes in visualizing complex data and deciphering relationships from data.
Shiny creates interactive plots in R and thereby resolves the problem of writing codes in R to plot graphs.
The biggest feature of Shiny is that no knowledge of Javascript, HTML or CSS is required.
Advantages:
- Both front end and back end are in R
- Highly customizable UI and Charts
- Unbeatable drill-down and simulations
- Number and Placements can be decided by the user
- Easy integration with R and JS libraries
Leverge your Biggest Asset Data
Inquire Now
Leverge your Biggest Asset Data
Disadvantages:
- Dev cost is high
- Less control in relation to scalability
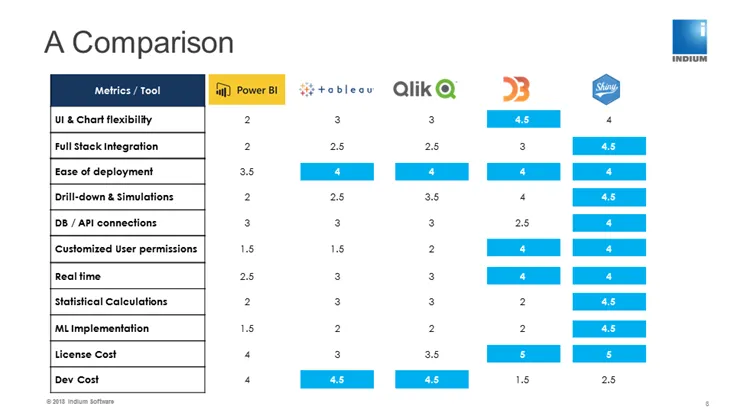
Below is a comparison table that our data scientists compiled with the various usage parameters in mind:

I hope this blog gave you an insight as to which visualization tool you need to pick to make your business grow by leaps and bounds.
The post A Comparison of the Best Data Visualization tools today! appeared first on Indium Software.