A Campaign for Data Science in STEM Curriculum
Blog: The Tibco Blog
“I want to include data science in my curriculum, but I can’t find anything useful on the Internet. Can you help?” asked Bill Gibson, a computer science teacher at our local high school. Bill knew I was a geek, but not that I’m the head of analytics at TIBCO. Thanks to this serendipitous exchange, we’ll be introducing his students to a critical STEM field for the 21st century.
Bill is prescient and his students are lucky. But all kids entering high school and college should get some exposure to the wonderful world of data science. McKinsey & Company projects that by 2018, the United States could face a shortage of 140,000 to 190,000 data science workers. Harvard Business Review called data science the Sexiest Job of the 21st Century. The average data scientist earns over $113,000 a year.
However, even though data science is a “sexy,” growing, and pays well, we’re not teaching it. It’s estimated that only about 5% of universities have a data science curriculum, and even fewer high schools expose students to data science. What gives?
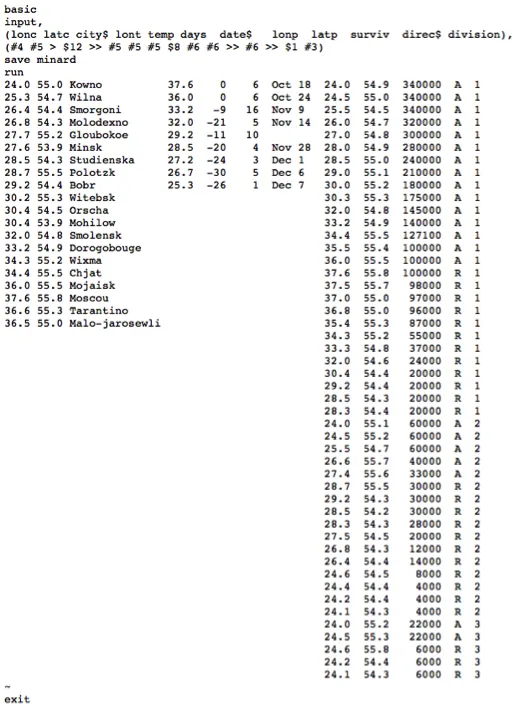
Let’s start with defining data science: “the field of extracting knowledge and insights from data in various forms,” according to Wikipedia … yes, I can hear the collective bored sighs of teenagers across the nation. So let’s try a more exciting visual explanation about what data science can do. Consider the following code:

Not exactly compelling. But data science is what turns such dull numbers into something stunning, like this:

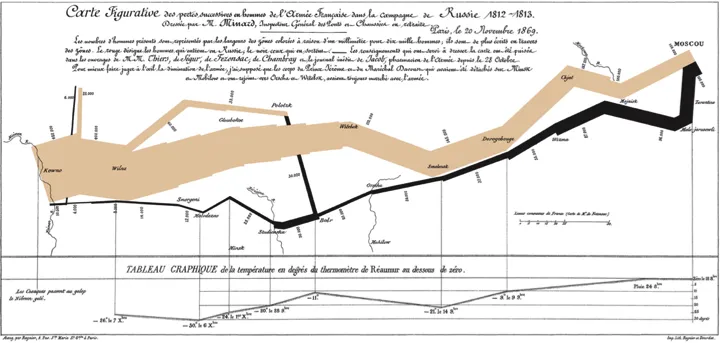
This famous image tells a story. Known as “the map that made a nation cry,” it was created in 1869 by Joseph Minard and has been called the best statistical graphic of all time.
Minard’s cartographic depiction of numerical data uses numbers to tell the devastating tale of Napoleon’s attack on Russia from 1812–1813. It quantifies, from left to right in tan, 422,000 French soldiers entering Russia in 1812. The tan line narrows to illustrate the vast numbers of men who died in the campaign (mainly due to the Russia’s “scorched earth” tactic). By the time the French get to Moscow, only 100,000 men survive. Black represents their retreat (right to left). The black line continues to get thinner as it moves west. Below the path of retreat, Minard also displays the time and temperature: When the French leave Moscow, the temperature is 0, then dips as low as 30 degrees below zero. Finally, a year later, the French army exits Russia as a thin stroke representing only 10,000 men. 412,000 men perished.
Minard’s graphic is a marvel. It shows six dimensions of data in one vivid image: the number of troops, their direction of travel, their location, the temperature, the time, and situation relative to specific dates. Creatively, it is the data geek’s equivalent of the Mona Lisa. Like any work of art, you see more as you linger over it. For example, on September 28, 1813, the thickness of the black line is cut in half as 25,000 men perish trying to cross the Berezina river.
Today, between one and two TRILLION statistical graphics like this are created every year. Minard used pen and paper, but most are now created on a computer. Statistical graphics speak powerfully and can influence all sorts of change in the world: they explain weather patterns, predict crop yields, help discover new drugs. They can even “make a nation cry” like Minard’s diagram.
Data science now impacts every profession, from entry-level office workers to CEOs, from football coaches to general managers, from accountants to CFOs. Minard was a civil engineer who hated war, which drove him to create his masterpiece. Millions of others have subsequently been inspired to speak through data.
So why does McKinsey project such a serious shortage in data worker supply? Because businesses now have new forms of data available to them at a scale that is historically unprecedented. In the past 20 years, everything has become connected—the internet, mobile phones, embedded sensors. And every device generates data. All that data needs to be analyzed.
Consider the Vestas company, which runs wind farms. Each of their 52,000 windmills has 1,000 sensors that send data readings every few seconds. That equals two gigabytes of readings each day. In terms that might speak to the average high school student, this means the windmills of just one company generate the equivalent of 15 million text messages or 2,000 printed books. EVERY DAY!
So there’s a lot of data, with more on the way, and lots of data scientists are needed to make use of it all. Data science is only growing more critically important as our technology advances. It will be key in all businesses in the future and there looks to be a massive shortage of data pros, a job that pays well and is fun. It helps us tell important stories. I don’t need to produce an infographic to make this tale any more compelling. Bill Gibson’s instincts are right, data science deserves a spot in every STEM education curriculum.