5 reasons why you should consider simulating your processes
Blog: Colin Crofts - Business Process Improvement
How many organisations are problem-free, have no issues with quality, delivery, customer feedback or cost control? How many organisations suffer no growing pains? How many are able to introduce new products and services, and run projects to deadlines and budgets?
If you run, or work for one of these organisations then you can stop reading this blog now, as you don’t need consider simulation. However, if, like the majority, you’re one of the poor unfortunates then you might want to read on.
These problems usually have their origins within the processes your organisation use rather than the people who operate them, and so process improvement techniques are typically employed to overcome or alleviate them. At the heart of these techniques are two commonly used tools: Process mapping and value stream mapping.
Process mapping focuses on the various steps within a process, showing their order and outcomes. Here’s a small section of a complex Loan Application process map: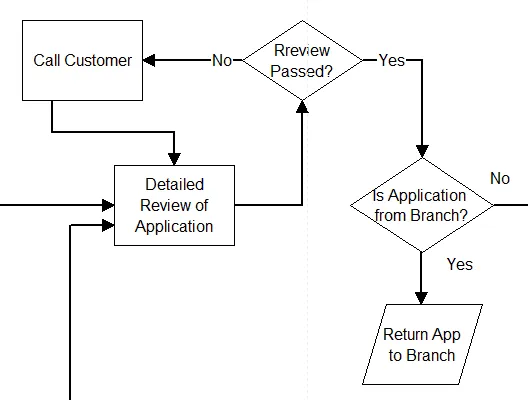

Value stream maps tend to employ a more helicopter view of a process, and these focus more on inventories, resource levels, and lead times. This is a fairly generic example: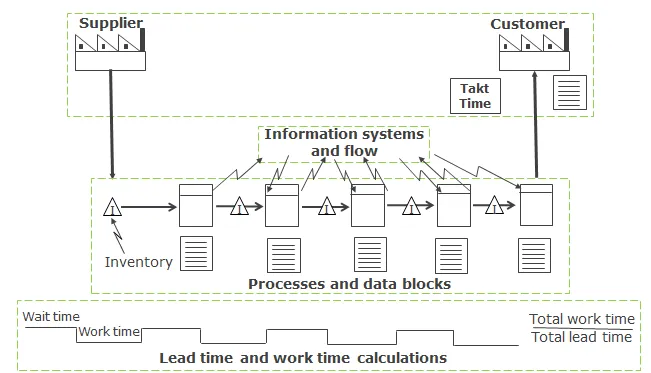

The idea behind the creation of these maps is to reveal the origins of the problems which exist within processes so that suitable solutions can be arrived at. Process or Value Stream maps are rarely enough on their own, however, as they need to be supported by data. But what data do you supply? Here are some examples:
• Lead times, change-over times and cycle times
• Entity arrival rates (an entity can be an order or a customer)
• Inventory rates and queue times
• Head count and equipment utilisation rates
• Scrap or rework rates
• Decision outcomes (proportions of each outcome for example)
• Entity arrival rates (an entity can be an order or a customer)
• Inventory rates and queue times
• Head count and equipment utilisation rates
• Scrap or rework rates
• Decision outcomes (proportions of each outcome for example)
The problem is, this data is almost all provided in the form of averages.
A simulation is something that represents something else. It isn’t the real thing. At times you might perform a simulation as practice for real life, such as a flight simulation used to train pilots.
Process simulation in particular usually utilises computer technology to aid the design, development, analysis, and optimisation of processes. It usually combines powerful graphical outputs with extremely sophisticated calculating routines to get very close to reality.
So why simulate?
Let’s get back to the original question; why you should consider using simulation techniques for your processes? I suggest that there are five main reasons for this:
1) Working with averages just isn’t good enough
Most traditional improvement analytical techniques work with averages. These are nice and easy to understand and work with, but they just don’t represent reality. Consider this simple process:

Here we have a customer going through three simple, linear steps each taking 5 minutes to complete. Imaging there is no travel time between the steps, the total cycle time will obviously be just 15 minutes.
Now, what if customers arrive regularly at exactly 5 minute time intervals? What would be the total cycle time then? It would still be 15 minutes!
What happens, however, if we introduce some variability into the scenario? Let’s say that each step still takes 5 mins on average, but it could vary in a random fashion from say 4 to 6 mins. What will happen to the total cycle time now?

It will start to increase; and will continue to increase! In this case, up to 25.3 mins over a typical 8 hour shift. Why is that?
It’s because every time an activity takes more than the average a queue is created and this time, now lost, cannot be made up.
What would happen if a similar variability was added to the arrival pattern of the customers? (i.e. they arrive up to 1 minute before or after the 5 minute average). This would increase the total cycle time to 31.2 mins by the end of the 8 hour shift.
This doubling in cycle time implies some significant waiting time for customers, or significant increases in staffing levels to keep the process flowing at planned rates.
2) Complexity (interactions and non -linear spaces)
The example given above is really very simple and most real-life processes are more complex. They often involve decision points, parallel activities, rework loops, and all sorts of uncertainty – especially over arrival rates.
Processes and outcomes can interact with each other to create what are called non-linear spaces. Non-linear spaces are often created as distributions collide, and they are very difficult to envisage or analyse. Take a look at the graphic below – and this is simply the collision of two normal distributions.

Consider the process map below. Can you imagine working out how many staff you would need at each step? Or how many customers you are likely to lose as they give up waiting? Imagine the extra complexities of varying cycle times and staff competencies on top of this!
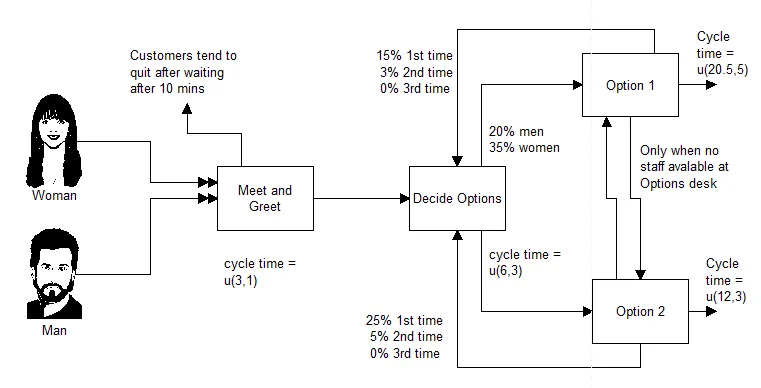
Simulation can cope with this and much greater levels of complexity!

Simulation can cope with this and much greater levels of complexity!
3) Visualisation
In point 2 we said that it is very difficult to envisage, as well as analyse, what is going on in any but the simplest processes. This is where visualisation helps. They say a picture paints a thousand words, and for most of us being able to actually see the flow of entities through the process, and also to actually see where the queues are forming makes it much easier for us to diagnose where cycle times are too long or resources short.
Visualisation enables us to see this type of information and, as a consequence, enables us to quickly diagnose the pinch points within a process. Take a look at the process below. It’s only a snapshot of a fully-flowing and dynamic simulation, but it gives the idea:
Visualisation enables us to see this type of information and, as a consequence, enables us to quickly diagnose the pinch points within a process. Take a look at the process below. It’s only a snapshot of a fully-flowing and dynamic simulation, but it gives the idea:
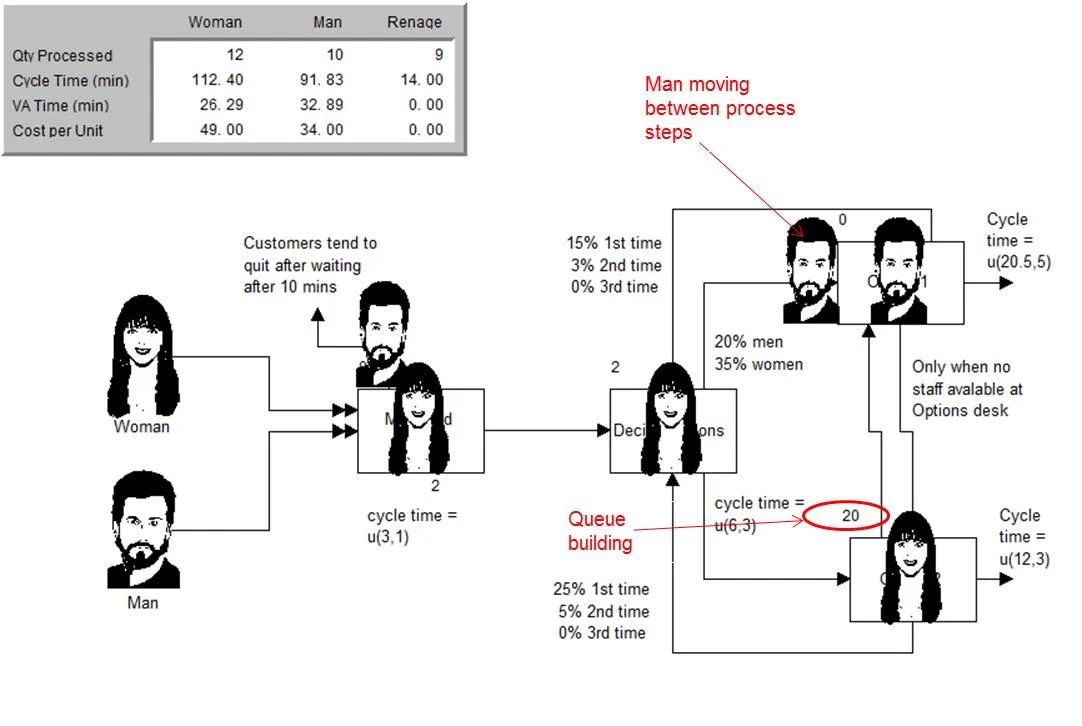
In it we can see examples of entities moving between stations and of where the queues are beginning to form. This gives us insights into where we need to focus our improvement activity.
We can also see an example of the types of data we can access and which can be invaluable for budgeting and planning processes. We see that we have, so far, processed 12 women and 10 men. We can also see that we have lost 9 customers, and that cycle times are very high. Costs per person are also displayed.
4) What if? scenarios
Imagine you have diagnosed these problems in the above process and need to something about it. What are you to do, and how do you know the proposed actions will suffice? This is where the ability to quickly and painlessly run your ‘what if’ scenarios is useful.
Here we can clearly see there is a problem with Option 2 taking too long, and we also have a problem with the Meet and Greet activity.
What could, or should, we do about these problems? There are typically three main options open to us:
• Reduce operation times
• Increase staffing or other resourcing levels
• Invest in time-saving technologies
• Increase staffing or other resourcing levels
• Invest in time-saving technologies
Which of these will be best? Do we a combination of all three? And if so, what will be the return on investment if we do take these actions?
These and other questions come to the mind of the Organisational Leader required to sign off such process interventions. Some questions never even come to mind, however. These are what Donald Rumsfeld famously called the ‘unknown unknowns’. Some of these unknown unknowns are unforeseen consequences.
In 2010, Boris Johnson laid out an example of how devastating these unforeseen consequences can be. In his article he argues that it is the fact that utility Companies were given the right to dig up the road without permit during privatisation in the 1980s which directly lead to traffic chaos. He suggests this right leads to over 300,000 holes per year in London’s roads, and the loss of over £1 billion in productivity to the Capital. The irony is that she only did this in an attempt to speed things up.
“I am afraid it all goes back to Mrs Thatcher. She decided – entirely reasonably – that these new concerns should be given every possible help in maximising efficiency and delivering services,” he wrote.“As a policy, that might have been sensible in the 80s, when there were only two or three privatised utilities. It looks utterly crazy today.”
Simulations can help us identify these unknown unknowns before they happen in real life. Take a look at the graphic below. It shows a situation where we have doubled the resource at Meet and Greet and halved the processing time at Option 2. It is clear that we have fixed the issues that these actions were designed to address, but unintentionally we have created two other bottlenecks as a result. One at Option 1, and another at Decide options.
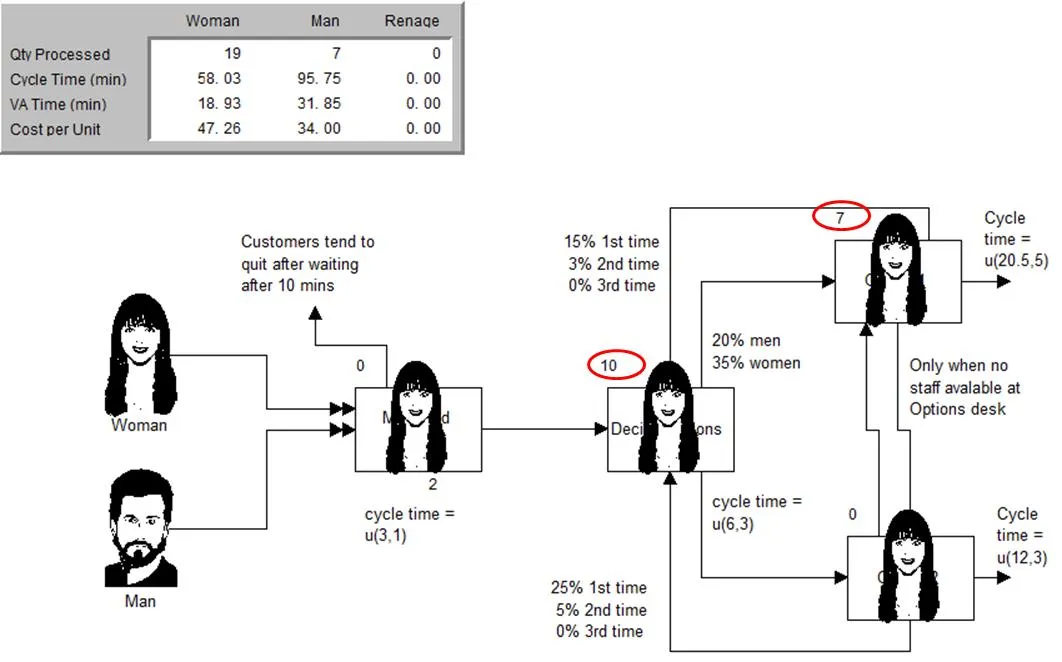
Using the ‘what if’ capabilities of simulation can prevent this type of issue from arising as you can see what blend of actions will be required to properly balance the process and to check out if you really are going to get the planned return on investment before forking out any actual cash.

Using the ‘what if’ capabilities of simulation can prevent this type of issue from arising as you can see what blend of actions will be required to properly balance the process and to check out if you really are going to get the planned return on investment before forking out any actual cash.
5) It’s fun
This brings us to the fifth reason why you should think about using simulation techniques. It’s fun! Creating, observing and using these models on your own real life processes is fascinating and rewarding. Most of us like playing games, and we also get fulfilment from completing the challenges they place before us. And these simulations are only make-believe and with no tangible reality!
Imagine the fulfilment you will get from creating models of real processes, and using them to suggest real changes, and enabling you to share them with your colleagues and bosses, and to then utilise then them to generate real profits for your Business. This is where fun and work can really intersect. And it’s the secret to real job satisfaction.
In this short blog I have set out to open your eyes to the power of process simulation and to the real tangible benefits it can offer. As in all things simulation presents its own challenges, but we at 100% Effective have the skills to create these models and we love to work with clients who can see the potential of simulation. Why not contact us and see if we can help in any way?