
3 Proven Ways of Turning Analytics into Valuable Insights
Blog: The Tibco Blog
Reading Time: 3 mins 30 sec.
More than 300 data analytics and business leaders gathered in Austin for Forrester Data Strategies & Insights 2019 in November to further transform their organizations into insights-driven businesses. As noted during this year’s conference by Boris Evelson, Vice President and Principal Analyst at Forrester, insights-driven businesses outperform their peers 8x to 10x—something we’ve seen with TIBCO customers like JetBlue, Goya Foods, and Verisk.
Enterprises can reduce information silos by adopting and operationalizing analytics to gain a significant competitive advantage. In this blog, you’ll learn what we saw and shared at Forrester Data Strategies & Insights, as well as three proven ways to start being insights-driven.
3 ways to turn analytics into insights and outperform your competition:
Democratize analytics: By making it easier for data scientists to build analytics apps for their business users, more users can explore insights that matter to their teams and the organization. And with NLQ capabilities, business users can query the data without needing to wait for analysts to assist.
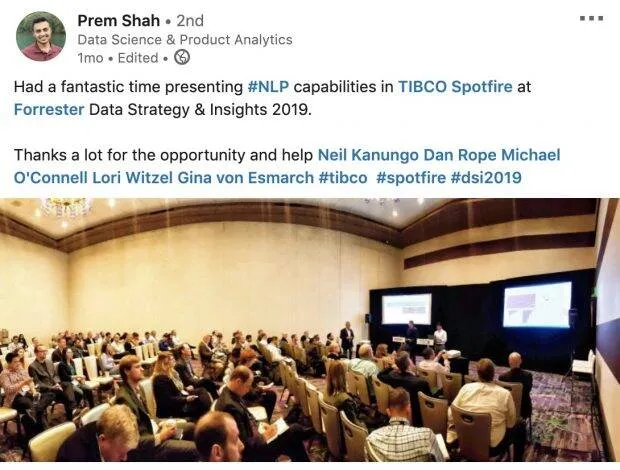
In a visual analytics and text analytics bake-off, moderated by Boris Evelson, TIBCO Data Scientist Prem Shah, demonstrated how democratizing analytics can open the door to greater insights for everyone. By analyzing a wine review data set with the powerful TIBCO Spotfire® visual analytics platform, he extracted Natural Language Processing (NLP) insights from wine reviews using point-of-sale tagging and fuzzy match. Data scientists like Shah can use Spotfire® not just to analyze, but to build self-service dashboards that business users can access, much like the one he shared during his demo.
So that everyone in an organization has access to insights and can make the best decision possible based on those insights.
Visualize more deeply: Dashboards need to be part of a broader visual analytics strategy that includes exploratory analysis and self-service apps, to empower discovery for the analyst and business user alike. By augmenting historic data with real-time data streams, more valuable insights can be revealed quickly.
Shah illustrated this practice during his wine review data analysis. He highlighted graphs including the word “tannin” and developed insights around tannin strengths. Shah then connected these insights with structured data like price, country, and other variables to show how wine merchants can use this data to source wines by region, based on tannin strengths. Spotfire® made it easy to visualize more deeply and explore previously hidden relationships for insights.
Infuse your organization with a culture of being insights-driven: A best practice discussed by Forrester at this event was for organizations to stop siloing data strategy and analytics—share learnings and best practices across teams and departments. Align analytics efforts with high-value organizational goals. Evangelize non-intuitive insights and the transformational power of analytics.
Shah certainly transformed the data in his presentation in a way that could easily be pushed out to the rest of an organization. By adding historical price and demand data for grape varieties from California for 1994 to 2017, Shah built demand and price forecasting and price elasticity models to gain insights into financial planning on cost and consumption forecasts. And he did all that in less than 30 minutes! Here’s a link to Shah’s recap of the experience on social media.
If you can successfully democratize analytics, enable deeper visualizations, and foster a data-driven culture, you’ll quickly outpace the competition. As the most complete analytics solution in the market, TIBCO Spotfire® empowers organizations to utilize all of these tactics to become digital leaders in every industry.
Whether you attended or not, “The Forrester Wave : Enterprise BI Platforms (Vendor-Managed), Q3 2019” should be of interest as you plan your data strategy and insights future: Download the full report now.