20/20 Vision – Innovation Game in Action
Blog: Tyner Blain

Having an outside-in bias as a product manager is important – you need to understand how your customers (or your customer’s customers) would value capabilities you might build into your product. When running a workshop to collect that information, playing some “serious games” is a great way to get more and better information. We ran a few 20/20 Vision games last week, to great effect.
Innovation Games
If you are a product manager (or play one on tv), and aren’t already familiar with Innovation Games, you should be. These are games that intentionally structure different brainstorming and elicitation exercises to be effective at eliciting information from participants. As a bonus, they are engaging, fun, and easy to run. They are effective because of the psychological biases that are implicit in the way they are structured, and because they are fun. I have been shamelessly stealing pieces of what Luke Hohmann (he also runs Enthyosis) and the rest of the Innovation Games team are doing ever since the Innovation Games book came out.*
Product Management Process
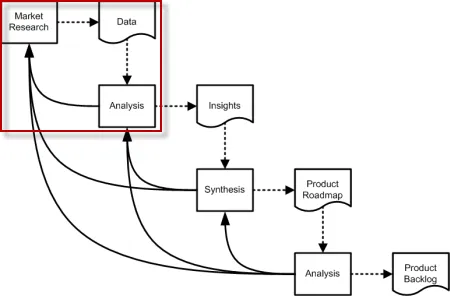
When I’m teaching product management, I use a version of the following diagram to describe the product management process
The 20/20 Vision innovation game helps in the first steps of this process – gathering market data, and gathering prioritization data to help with the analysis of the gathered data.
Customer Journey Mapping for Product Management

Customer journey mapping is a tool developed in the user experience domain, designed to get a view of the customer’s experience – taking into account a more comprehensive view than you would get from a storyboard – which would capture a single-purpose set of interactions. Chris Risdon of Adaptive Path has a great presentation explaining customer journey mapping, from the 2012 IA Summit. He’s one of the thought leaders to whom you should listen. Customer journey mapping helps you create a framework for comprehensively understanding and improving how customers will experience your product in the context of their reality – and from the customer’s point of view. It is a great tool for anticipating the emotions that customers (users) will experience as they interact with your product(s).
By analogy, if a wire frame is a static view of the product with which someone interacts, a journey map is a dynamic view of the experience they will have. As a product manager, I saw a great opportunity to co-opt (much of) the journey mapping approach as a way to organize and understand the needs of the users, for a complex set of B2B2C products.
Understanding the B2B2C (Business to Business to Consumer) Model
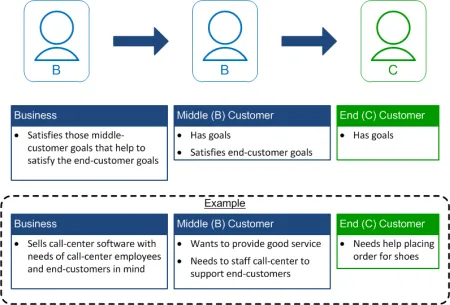
For folks who don’t know B2B2C, it is “business to business to consumer.” If your company is an OEM (or the software equivalent), and your customers are other businesses, who use your products to service their customers, you have a B2B2C product. This extra layer of abstraction makes it more challenging to be develop Outside-In software when figuring out what is most important to the end users. As a B2B2C product manager, you need to identify not only the things that are important to your (direct) customers, but also the things that are important to their customers.
The above diagram shows a simple example of a B2B2C relationship – sometimes pictures work better than paragraphs.
Through the course of a two day workshop with a couple dozen end-users, we identified a few hundred interactions / touch-points / experiences that end-users have throughout a customer journey that was framed in 26 steps. Anecdotally, some steps would look exactly the same to the “middle (B) customer”, but appreciably different to the end (C) customer.
One insight that we wanted to capture was the relative importance of each step in the journey to the (end) customer’s perceptions of the experience. This would allow us to inform our hypotheses about the relative importance – to the middle (B) customer – of investments in improving the end (C) customer experience.

This prioritization exercise – identifying which steps were most important to users (end customers) – happened after identifying the steps in the journey and the important interactions within those steps.
We had teams of 4 to 6 people, each representing different personas (because you should not design a solution for “everyone”, but rather for groups of people) working together and in parallel throughout the stages of the workshop. Each persona-group was then asked to play the 20/20 vision game, to put the 26 steps in relative priority order. The exercise proved to be pretty quick and engaging for each team. We gathered some good qualitative insights from the debates within each team, and from the analysis of similarities and significant differences in relative-importance across groups.
We also had the teams, for those steps that were identified as the most important to them, play the 20/20 game again. This time, the teams put the individual interactions / touch-points within each step into relative order by importance of the interaction to their perception of customer experience. This time, the games were played with more like a dozen items to prioritize at a time. Some steps had more than 50 interactions identified, but with duplication (we did exercises to cluster equivalent interactions together), the number of items being put in order was consistently below 20.
Conclusion
Being market-driven is important when defining which problems products should address (or address more effectively). The right place to start is by internalizing the customer’s perspective on the actual problems to solve and the context in which they live. A precursor to doing this is identifying who the customers are.
The next step is to form hypotheses about the value – to the customers – of solving these problems. Co-opting the mechanics of customer journey mapping, and adding in a couple prioritization exercises worked well for me, in achieving these goals.
Next up – developing insights from what this effective data-gathering exercise yielded.
Attributions & Disclaimers
Thanks Michael Cory for the eye chart image
*I know Luke personally, have done agile product management and training work for/through Enthyosis in the past (and hopefully will again in the future). I’m a big fan. So yes, this article reads with a bias – but only because the stuff is both good and useful to me and I believe it would be for you.
 [
[ [
[