
How to Perform a Bottleneck Analysis With Process Mining
When you perform a process mining analysis, then the discovered process map and the variants are only the starting point. You then want to dive deeper into the process based on the questions that you have about it.
One of the typical questions is about the performance of the process. For example, you may have a service level agreement (SLA) with respect to the overall throughput time of the process. Within Disco, you can analyze the case duration distribution and you can filter your data to focus on the slow cases to find out where in the process they lose so much time (see also the video at the top for a demonstration of how to do this).
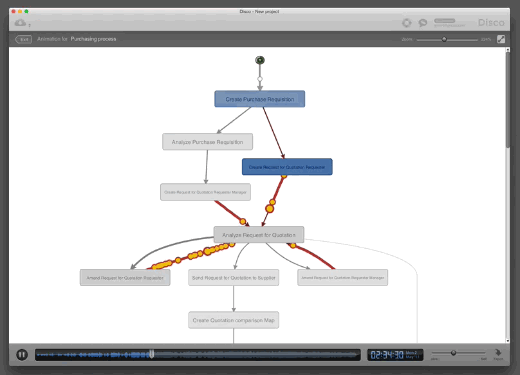
Once you discover a bottleneck in your process, the animation is a very powerful tool to visualize the bottleneck to your co-workers. Rather than just giving them abstract statistics and charts, they can literally see where a lot of the cases are piling up and where the queuing occurs (see below). This will help you to explain your findings and engage them in discussions about how the process can be improved. As soon as a bottleneck has been resolved, you can focus on the next one to support a continuous improvement of your process.
Once you dig into the performance analysis for your process, there are two things to know that can be helpful. So, in this article, we want to give you these two tips that…
Leave a Comment
You must be logged in to post a comment.