
Leveraging Grafana for OIC Metrics by Niall Commiskey
Blog: PaaS Community

OCI Logging and OCI Logging Analytics are compelling offerings, but some folks may have standardised on other monitoring tools, such as Grafana.
So no time like the present to look at how one can leverage Grafana to monitor OIC Service Metrics. My colleague Valeria C. has already done great work in this area and has provided me with the impetus to get started. But first, I need Grafana!
Step1 install Grafana on an OCI Compute instance.
Step 2 install the Grafana OCI Metrics plugin.
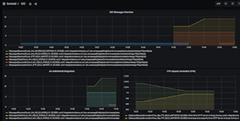
Step 3 monitor!
Install Grafana on OCI Compute instance
1. Spin up a compute instance
2. ssh into the instance
3. install Grafana – currently we need a version under v8. Read the complete article here.
For regular information on Oracle PaaS become a member in the PaaS (Integration & Process) Partner Community please register here.
![]() Blog
Blog ![]() Twitter
Twitter ![]() LinkedIn
LinkedIn ![]() Facebook
Facebook ![]() Wiki
Wiki
Technorati Tags: SOA Community,Oracle SOA,Oracle BPM,OPN,Jürgen Kress
Leave a Comment
You must be logged in to post a comment.